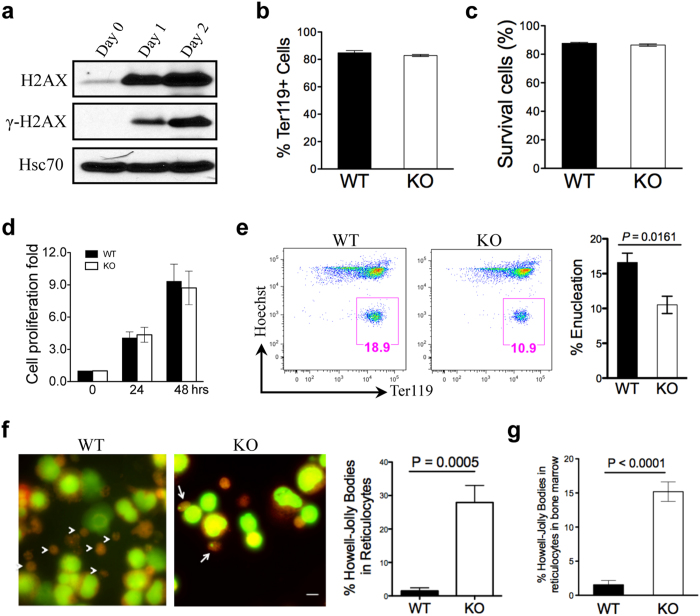
Figure 3. Loss of H2AX affects enucleation in late-stage terminal erythropoiesis.
(a) Western blot analysis of H2AX and γ-H2AX levels in cultured mouse foetal liver erythroblasts with erythropoietin. Hsc70 was used as a loading control. (b,c) After 2 days in culture, cells were harvested. (b) Cell differentiation was assessed using flow cytometry to quantify the percentage of Ter119-positive cells. (c) Cell survival was assessed quantifying the percentage of annexin V- and propidium iodide-negative cells. (d) Quantification of cell growth over time (relative fold change in number of cells). Data are shown as mean ± SD from three independent experiments. (e) Flow cytometric analysis of enucleation using Hoechst 33342 and Ter119. The boxed regions with percentages represent enucleated cells. Quantification of enucleated cells is to the right. Data are shown as mean ± SD from three independent experiments. (f) Acridine orange staining of cytospin slides of cultured foetal mouse liver cells. Arrowheads indicate reticulocytes, and arrows indicate reticulocytes with Howell-Jolly bodies. Quantification of reticulocytes with Howell-Jolly bodies is to the right. Scale bar: 5 μm. Data were obtained from three independent experiments and are shown as mean ± SD. (g) Quantification of reticulocytes with Howell-Jolly bodies in bone marrow smears. Data were obtained from three independent experiments and are shown as mean ± SD.

