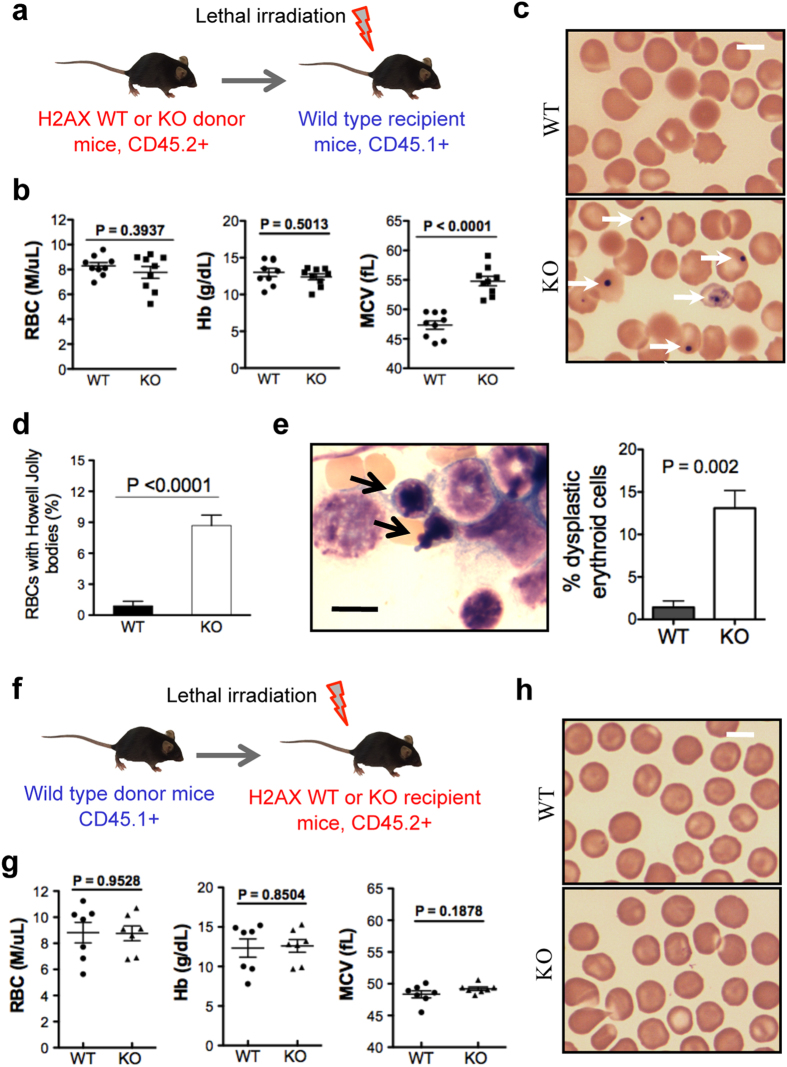
Figure 4. Dyserythropoiesis resulting from loss of H2AX is cell-autonomous.
(a) Schematic illustration of bone marrow transplantation strategy. (b) Peripheral RBC count, haemoglobin (Hb), and mean corpuscular volume (MCV) in recipient mice (CD45.1-positive) 1 month after transplantation of bone marrow cells (CD45.2-negative; n = 9 per group). (c) Representative images of peripheral blood smear from mice in (b). Arrows indicate red blood cells with Howell-Jolly bodies. Scale bar: 5 μm. (d) Quantification of red blood cells with Howell-Jolly bodies in (c). Data are shown as mean ± SD. (e) Representative image of Wright-Giemsa staining of bone marrow smears of mice transplanted with H2AX knockout bone marrow cells. Arrows indicate dysplastic erythroblasts with nuclear budding. Scale bar: 10 μm. Quantification of the percentage of dysplastic erythroblasts among all bone marrow erythroblasts is shown to the right (n = 3 per group). Data are shown as mean ± SD. (f) Schematic illustration of reverse bone marrow transplantation strategy. (g) Peripheral RBC count, Hb, and MCV of H2AX knockout and wild-type recipient mice 1 month after transplantation of bone marrow cells (CD45.1-positive; n = 7 per group). (h) Representative images of peripheral blood smear from mice in (g). Scale bar: 5 μm.

