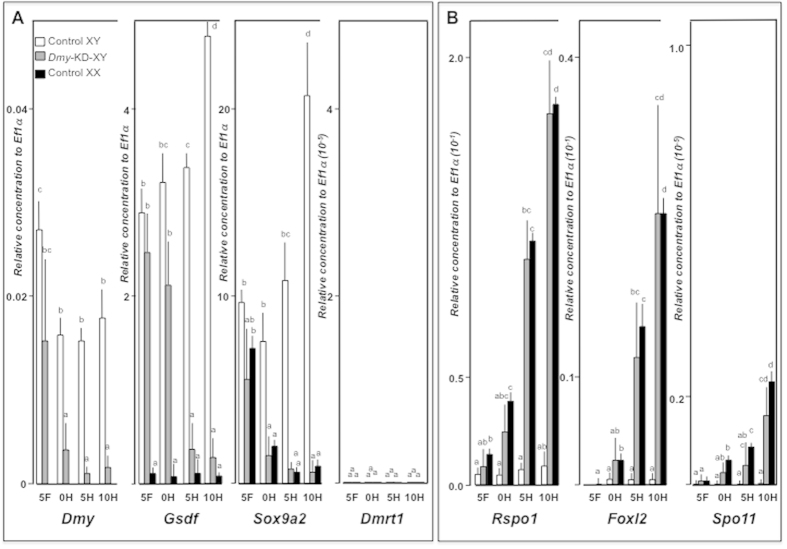
Figure 3. Dmy-knockdown induced transcriptional alterations of male and female associated genes.
(A,B) Ontogenic changes in the expression of male (Dmy, Gsdf, Sox9a2, and Dmrt1) (A) and female (Rspo1, Foxl2, and Spo11) (B) associated genes from 5 daf (5F) to 10 dah (10H) were analysed by real-time PCR. Data were normalised with Ef1a expression. Each column in the graph represents mean ± SEM of 10 individuals of control XY (white columns) and Dmy-knockdown XY (grey columns) fish. Letters above the bars indicate that these groups differ significantly (p < 0.05) from each other.

