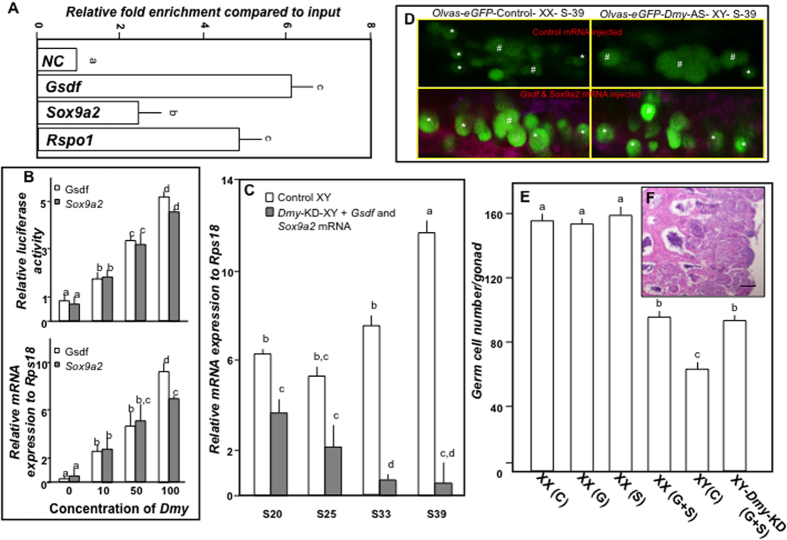
Figure 5. Gsdf and Sox9a2 are potential downstream targets of Dmy.
(A) In vivo chromatin immunoprecipitation analysis of candidate Dmy targets. Relative expression to control input was calculated using real-time PCR and plotted on the graph. Data are presented as means ± SEM of 4 separate experiments and significances (p < 0.05) are denoted by different letters. (B) Effects of Dmy overexpression on Gsdf and Sox9a2 promoter activity (upper panel) and mRNA transcription (lower panel) were ascertained. (C) Differences in Dmy expression between control (white columns) and olvas-eGFP-Dmy-KD co-injected with Gsdf-cherry and Sox9a2-cyan (grey columns) XY embryos during gonadal differentiation (S20-S39) were assessed using real-time PCR. (D) Representative images showing the germ cell distribution in Olvas-eGFP-control XX, Olvas-eGFP-Dmy-KD-XY embryos at S39 after control (upper panel) and Gsdf/Sox9a2 (lower panel) mRNA injection. Isolated and cluster germ cells are marked with ‘*’ and ‘#’, respectively. Note: Clustered germ cells are representative of female type gonadal development (N = 9/ group). (E) The total number of germ cells was plotted (Y-axis) against different injected groups (X-axis). Data are presented as means of 10 individuals (error bars represent SEM). Different letters (a–d) indicate significant differences from other groups at p < 0.05. Note: C, G, S, and G + S represents PBS, Gsdf-cherry, Sox9a2-cyan, and Gsdf-cherry/Sox9a2-cyan mRNA injected embryos, respectively. (F) The gonadal sexuality of olvas-eGFP-Dmy-KD embryos co-overexpressed with Gsdf-Sox9a2 (N = 7) was assessed at maturity. (Scale bar, 20 μm).

