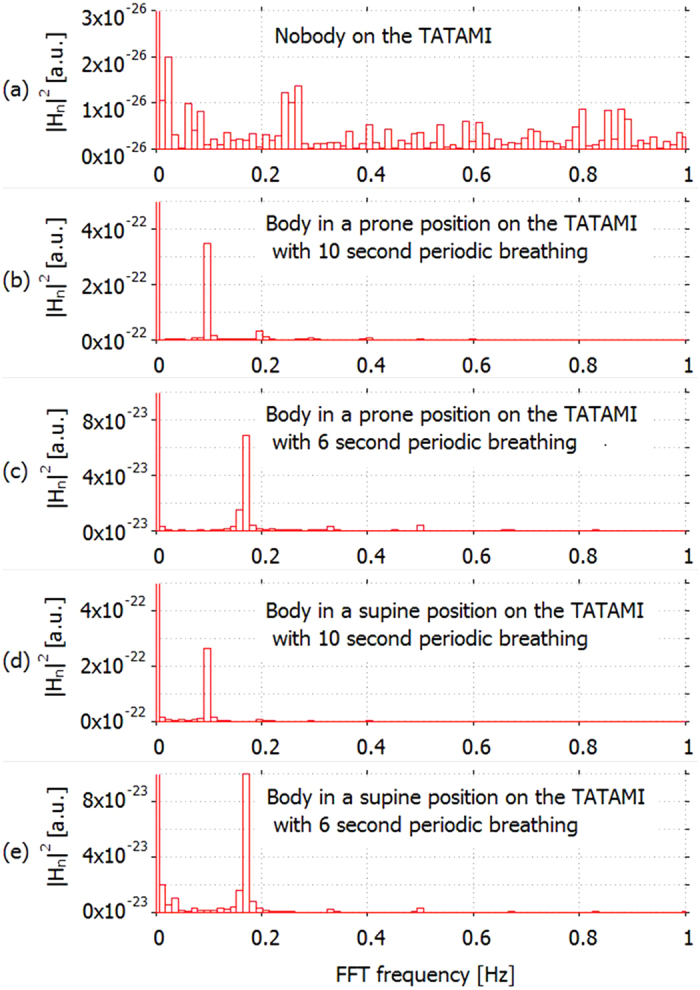
Figure 11. Calculation of frequency for visualization of the breathing period.

Frequency obtained by using the fast Fourier transform (FFT). The graphs (a–e) correspond to the data shown in Fig. 7a–e, respectively: no one on the tatami (a), the examinee on the tatami in a prone position with 10-s periodic breathing (~4 s for suction, ~2 s for delivery, and 4 s for apnoea) (b), a prone position with 6-s periodic breathing (~3 s for suction and ~3 s for delivery) (c), a supine position with 10-s periodic breathing (~4 s for suction, ~2 s for delivery, and ~4 s for apnoea) (d) and a supine position with 6-s periodic breathing (~3 s for suction and ~3 s for delivery) (e).
