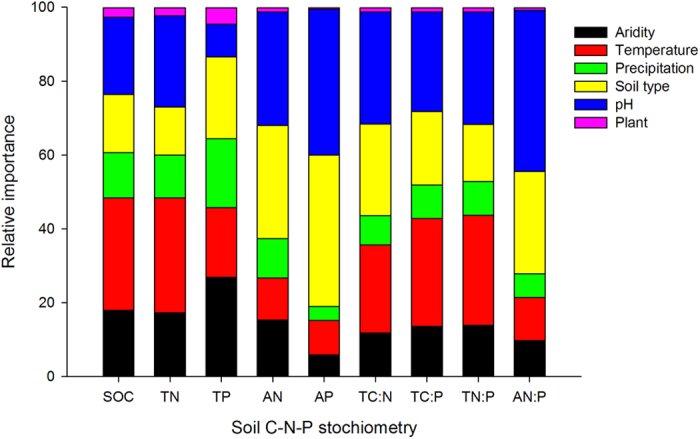
Figure 5. The relative influence of climatic and soil variables and plant cover on soil C, N and P.

The relative importance values add to 100% for each model. In each model, predictors with large relative importance values have greater explanatory powers. See abbreviations in Table 1.
