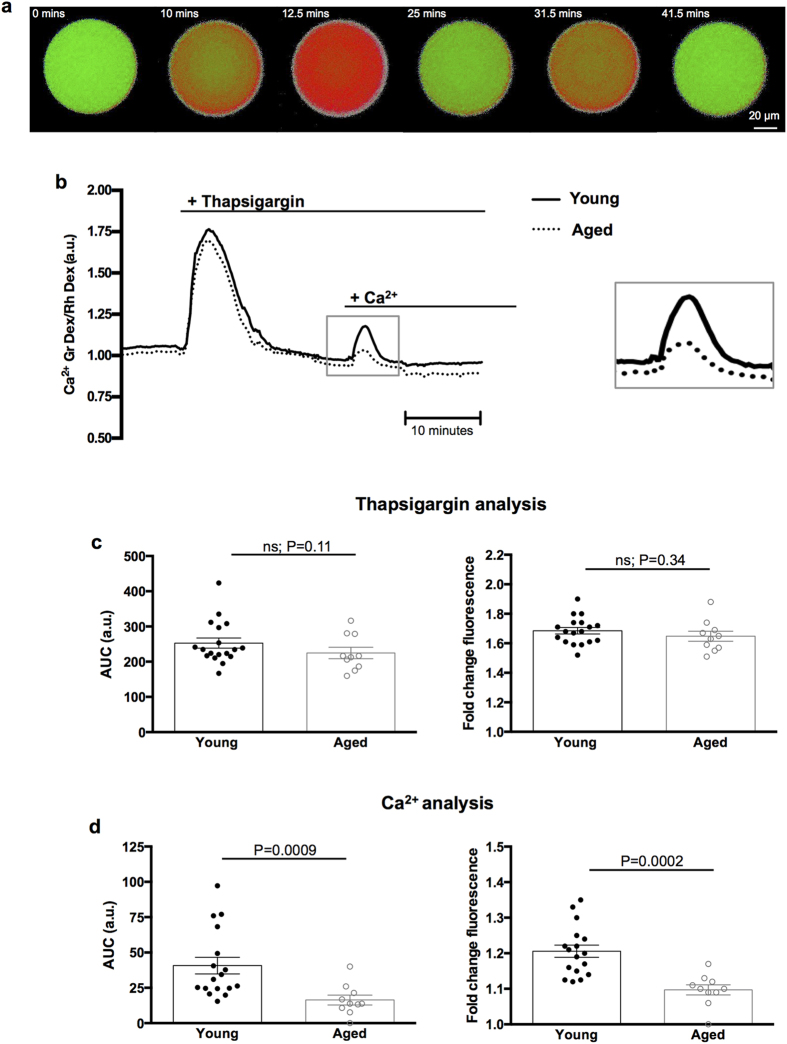
Figure 2. Naturally-aged eggs feature a reduced Ca2+ influx capacity.
(a) A typical Ca2+ response to thapsigargin followed by Ca2+ add-back is demonstrated with pseudocoloured time-lapse images, with warmer colours indicating higher [Ca2+]i. Numbers in the top left of each image panel represent minutes (mins). (b) Representative Ca2+ response curve in MII eggs from young and naturally-aged mice after treatment with thapsigargin (10 μm) followed by Ca2+ (1.7 mM) add-back. The Ca2+ add-back response curve has been magnified (grey box outline). (c) Quantitative analyses of the thapsigargin response in young (n = 18) and aged (n = 10) eggs. Area under the curve (AUC) and fold-change fluorescence ratio calculations revealed maternal age does not affect thapsigargin-sensitive [Ca2+]ER stores (P = 0.11 and P = 0.34, respectively). (d) Quantitative analyses of the Ca2+ -add back response in young (n = 17) and aged (n = 10) eggs. AUC and fold-change fluorescence calculations showed Ca2+ influx capacity is reduced with maternal age (P = 0.0009 and P = 0.0002, respectively). Experiments performed in Ca2+ -free media. ns indicates not statistically significant. a.u. represents arbitrary units. Error bars are s.e.m.

