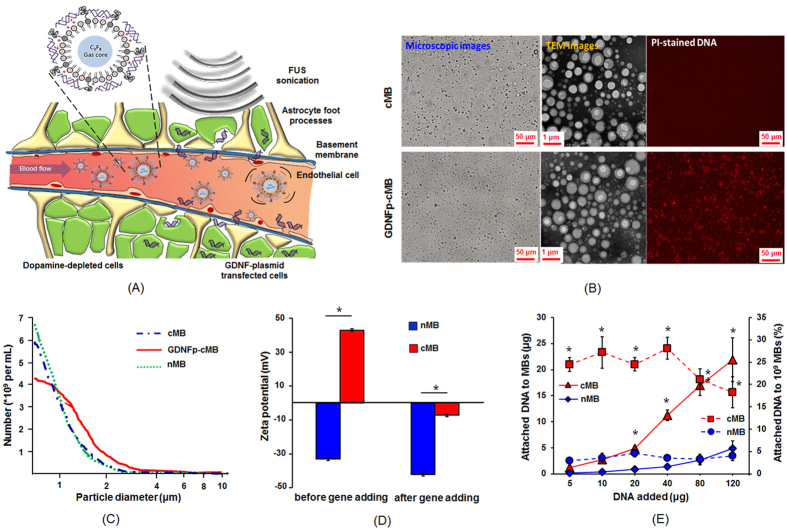
Figure 1. Concept and properties of GDNF-cMBs.
(A) Schematic of GDNFp-cMBs and mechanism for controlled gene transfection of GDNFp-cMBs into brain triggered by FUS. (B) Left: Microscope bright-field images; middle: TEM images; right: PI staining image of cMBs and GDNFp-cMBs. (C) Size distributions of cMBs, GDNFp-cMBs and nMBs. (D) Zeta potential of nMB and cMB before and after adding GDNFp. (E) DNA loading efficiency of GDNFp onto nMB and cMB. The left axis was the amount of GDNFp bound onto MBs (solid line). The right axis was the GDNFp loaded efficiency onto MBs (dotted line). Single asterisk, p < 0.05, versus nMBs. Data were analyzes by Student’s paired t-test presented as mean ± SEM (n = 6 per group).

