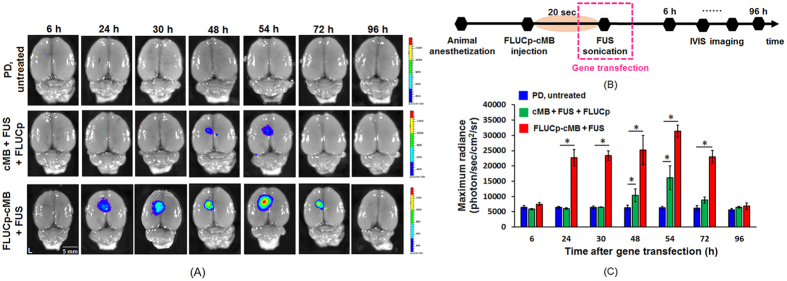
Figure 2. Ex vivo bioluminescent imaging after treatment.
(A) Ex vivo bioluminescent imaging acquired 6, 24, 30, 48, 54, 72 and 96 h after treatment. Upper: control rat without gene transfection; middle: cMB+FUS+FLUCp group; bottom: FLUCp-cMB+FUS. (B) Timeline of bioluminescent imaging after gene transfection. (C) Time course of bioluminescent intensity. Single asterisk, p < 0.05, versus PD untreated rat. Data were analyzes by one-way ANOVA (post hoc test: Dunnett; degrees of freedom: 6; F value: 9.7) and presented as mean ± SEM (n = 3 per group).

