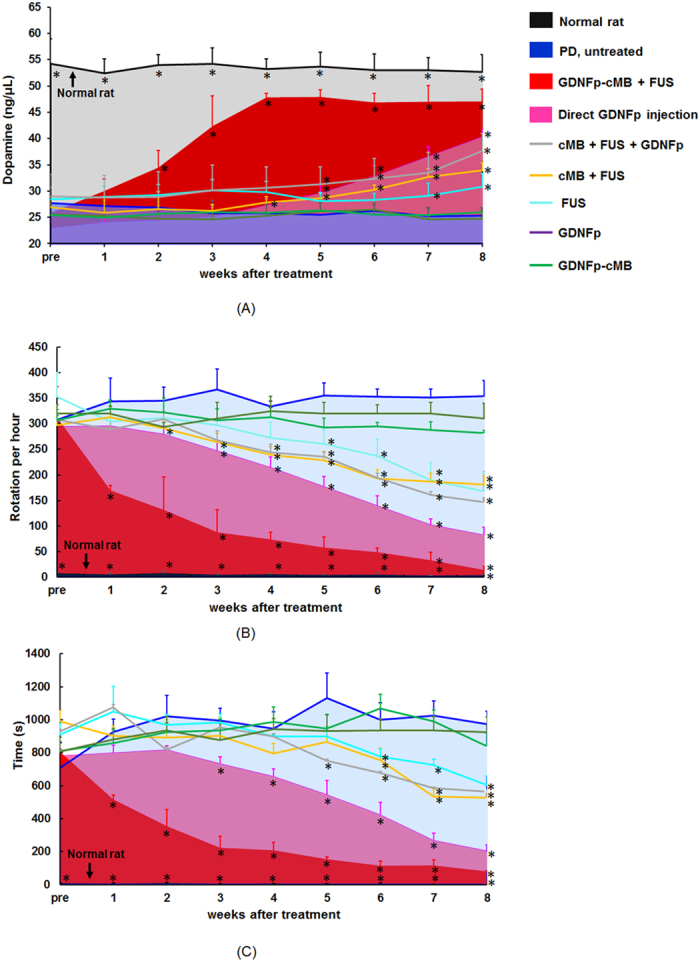
Figure 4. DA concentration and behavioral tests before and after treatment.

(A) Change in DA concentration before and after treatment. (B) Change in apomorphine-induced rotational behavior before and after treatment. (C) Results of the bar test before and after treatment. Single asterisk, p < 0.05. Data were analyzes by one-way ANOVA (post hoc test: Dunnett; degrees of freedom: 45; F value: 76, 149, 120.7) and presented as mean ± SEM (n = 6 per group). All of the data were compared with PD untreated rat.
