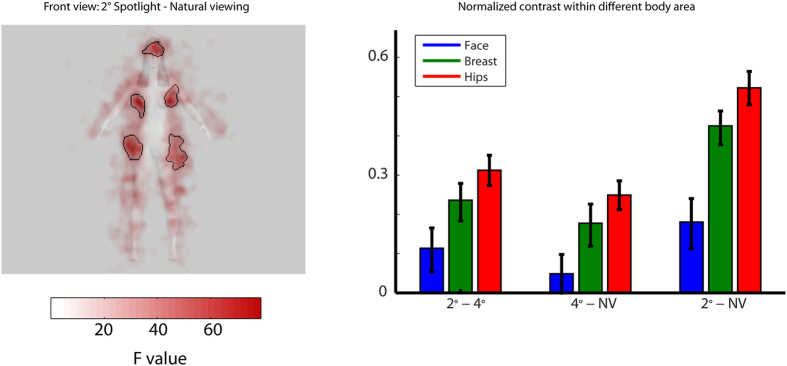
Figure 4. Left panel: difference fixation maps performed on the LMM (Eq. 2) between the front view 2° spotlight and natural viewing conditions.
Significant clusters are outlined with black lines. Right panel: normalized contrast among the three viewing conditions within different region masks from Left panel. Error bars report standard errors. Image generated with the software MakeHuman, under a PDD licence (public domain).

