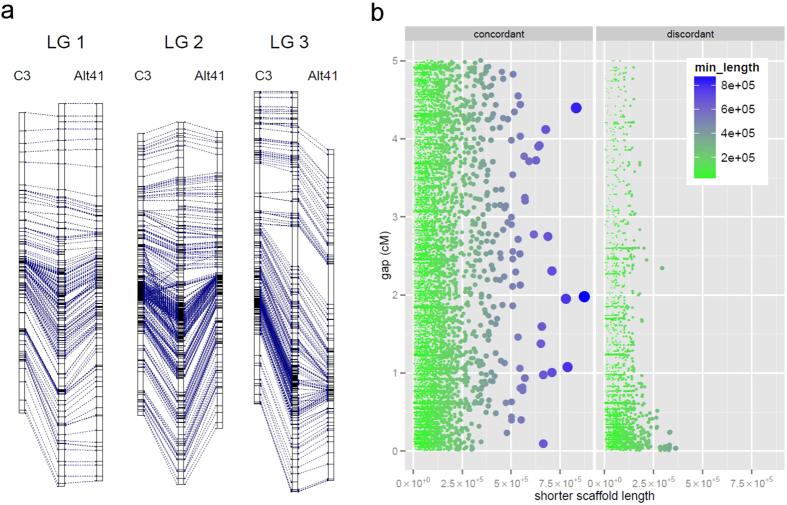
Figure 3. Anchoring the globe artichoke reference genome to the genetic maps and analysis robustness for each map.
(a) Alignments of parental maps with the inferred consensus map in the middle for the first three C. cardunculus linkage groups. (b) Distribution of sizes (x axis) and genetic distances (y axis) for every possible pair of scaffolds separated by up to 5 cM when comparing the two parental maps. Pairs are shown as concordant (left) if their relative genetic position is maintained in both maps; discordant (right) if it is not. Scaffold size is reported as the smaller size of the two scaffolds in a pair (size and color of dots emphasize the scaffold size).

