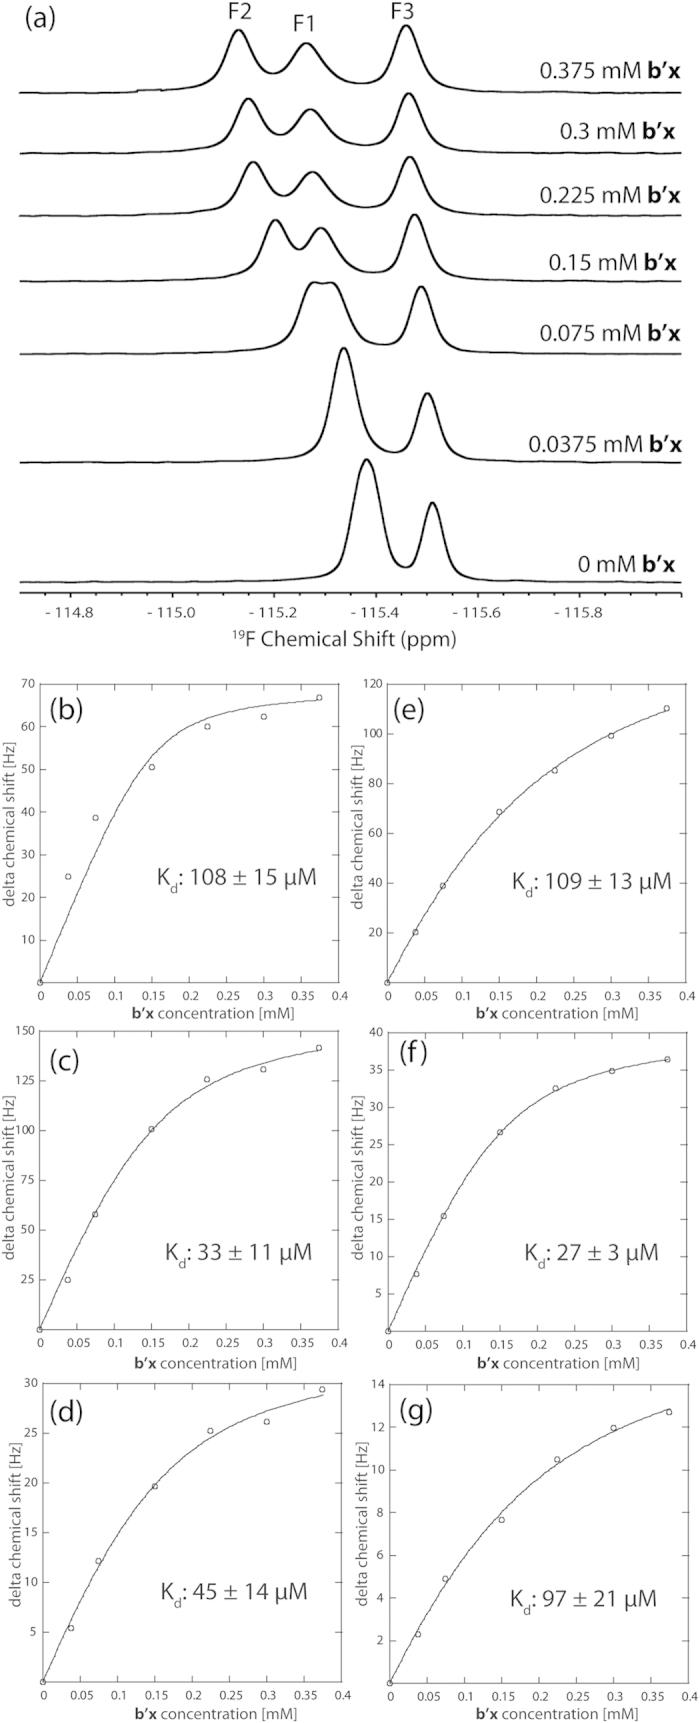
Figure 4. 19F NMR spectra of 0.15 mM F1,2,3 Δ-som with increasing concentrations of 15N b’x protein.

(a). Titration curves of each fluorine resonance from the F1,2,3 Δ-som peptide: F1 peak (b), F2 peak (c), and F3 peak (d) upon addition of increasing 15N b’x protein. Fitting the points to equation (1) provides the curves and gives an average Kd of 62 + 13 μM. Titration curves of each fluorine resonance using singly-fluorinated F1 Δ-som (e), F2 Δ-som (f) and F3 Δ-som (g) upon addition of increasing 15N b’x protein are presented for comparison.
