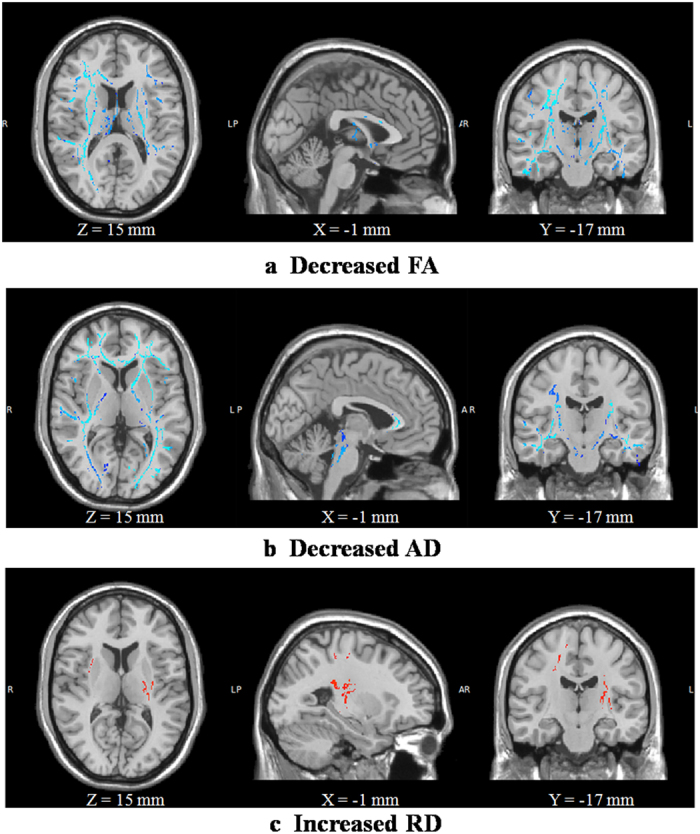
Figure 1. TBSS analysis of FA, AD and RD between S2 and S1.

Compared with S1, S2 showed significantly decreased FA (a), decreased AD (b) and increased RD (c) in extensive white matter regions (P < 0.05, corrected by TFCE and FWE). S1 and S2 are Scan1 and Scan2, respectively.
