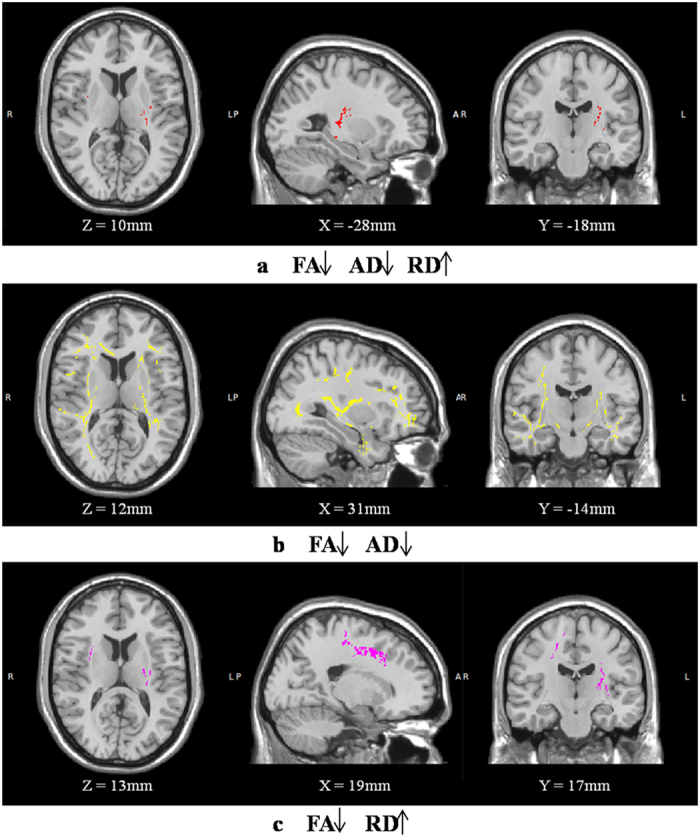
Figure 2. Overlapping white matter regions with changes in FA, AD and RD.

White matter regions with decreased FA, decreased AD and increased RD are shown in red (a). Regions with decreased FA and decreased AD are shown in yellow (b). Regions with decreased FA and increased RD are shown in purple (c).
