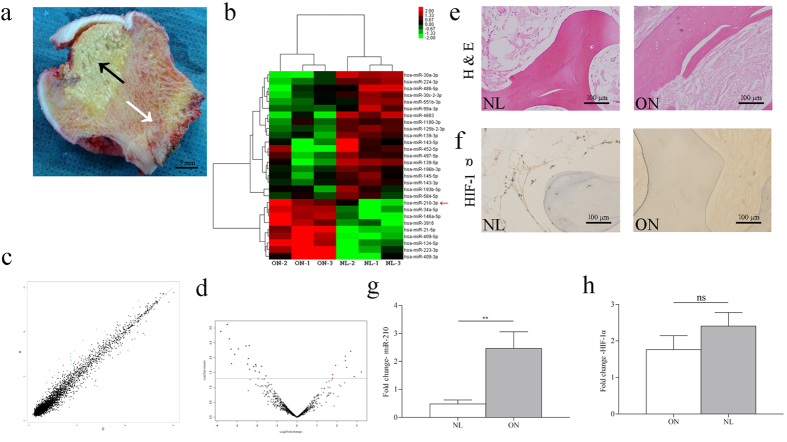
Figure 1. MiR-210 was filtered and validated in patient samples with SONFH.
(a) Two zones of samples were obtained, which were the osteonecrosis tissues (ONs, black arrow) and the matched normal tissues (NLs, white arrow). (b–d) Clustering, heatmap and volcano analysis of the miRNAs differentially expressed in ONs and NLs after the microarray. (e) Hematoxylin and eosin staining of the tissues, typical sign of empty lacunae was observed in ONs. (f) Immunohistochemistry staining for miR-210 specific regulator, HIF-1α. (g) The expression of miR-210 detected by microarray was confirmed by Q-PCR in the extended patient samples. (h) The expression of HIF-1α was examined by Q-PCR. *P < 0.05, **P < 0.01.

