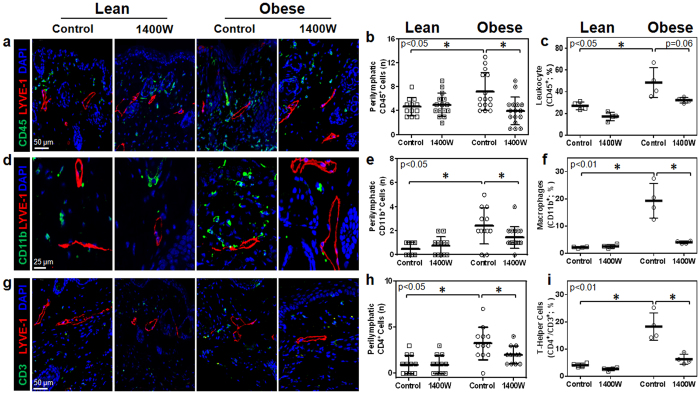
Figure 6. iNOS inhibition reduces inflammation in obese animals.
(a) Representative high power photomicrographs (40x) and quantification of (b) perilymphatic CD45+ cells (green) in hindlimb sections stained for LYVE-1 (red) (n = 5 animals/group; 4–5 HPF/animal, p < 0.05). (c) Hindlimb tissues assessed using flow cytometry to identify CD45+ cells as a percentage of live cells (p < 0.05). (d) Representative high power photomicrographs (80x) and quantification of (e) perilymphatic CD11b+ cells (green) in hindlimb sections stained for LYVE-1 (red) (p < 0.05). (f) Hindlimb tissues assessed using flow cytometry to identify macrophages (CD11b+/CD45+) as a percentage of total live cells (n = 4 animals/group, p < 0.01). (g) Representative high power photomicrographs (40x) and quantification of (h) perilymphatic inflammation in dermal hindlimb sections stained for CD4 (green) and LYVE-1 (red) (n = 5, 4–5 HPF/animal, p < 0.05). (i) Hindlimb tissues assessed using flow cytometry to identify T helper cells (CD4+/CD3+/CD45+) as a percentage of total live cells (p < 0.01).

