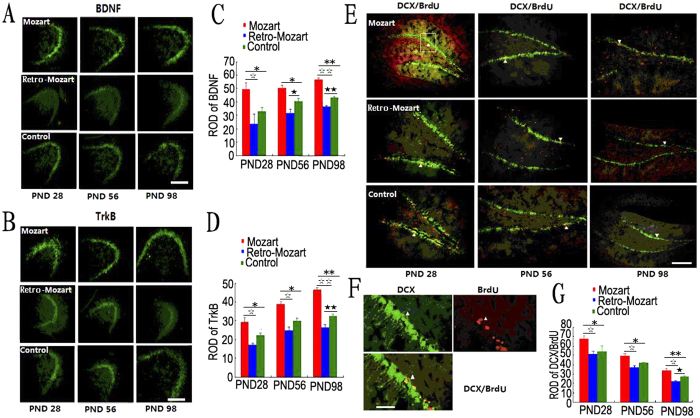
Figure 3. BDNF/TrkB protein expression level in the hippocampus and neurogenesis in the dentate gyrus after exposure to music.
(A–D) The drawings in (A–D) show the relative optical density (ROD) of BDNF and TrkB protein levels in the hippocampus of the MG, RMG and CG. (E) The newborn neurons were double-labelled for DCX (green) and BrdU (red) in the dentate gyrus at three different time points (under 10 × amplification). (F) Images of the DCX/BrdU-expressing cell of the white pane in E (under 20 × amplification). (G) The statistical results of the ROD of DCX/BrdU among the groups. The data represent the mean ± S.E.M. Asterisks denote significant differences between different groups. *, ☆ and ★ represent P < 0.05; **, ☆☆ and ★★ represent P < 0.01. N = 5 per group. Scale bar: 400 μm.

