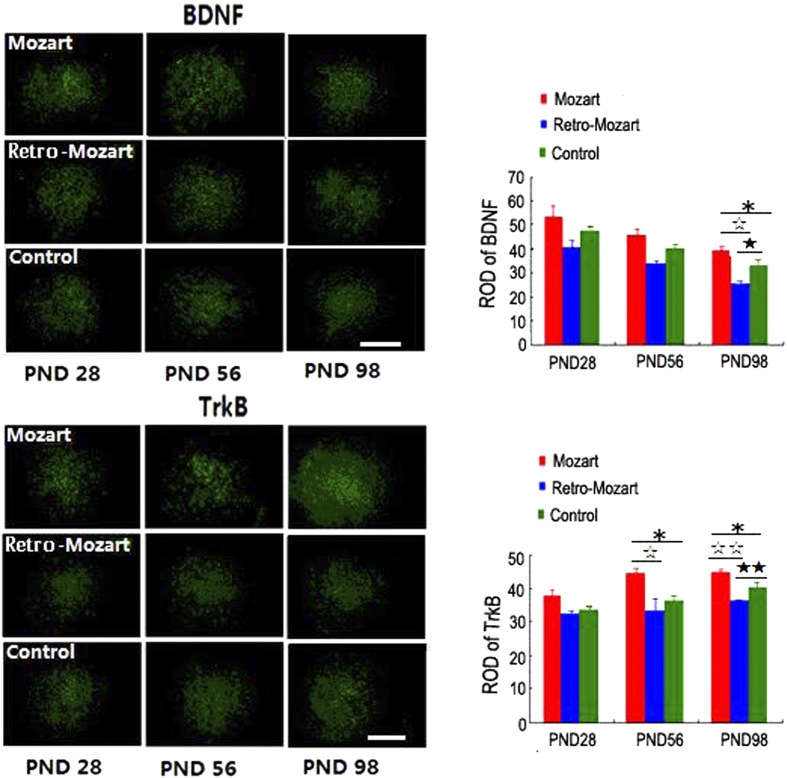
Figure 4. BDNF and TrkB protein expression level in the auditory cortex after exposure to music.
The drawings show the ROD of BDNF and TrkB protein levels in the auditory cortex of the control rats and the rats exposed to Mozart music and retrograde Mozart music. The error bars represent the S.E.M. Asterisks denote significant differences among the groups. *, ☆ and ★ represent P < 0.05; ☆ and ★★ represent P < 0.01. N = 5 per group. Scale bar: 400 μm.

