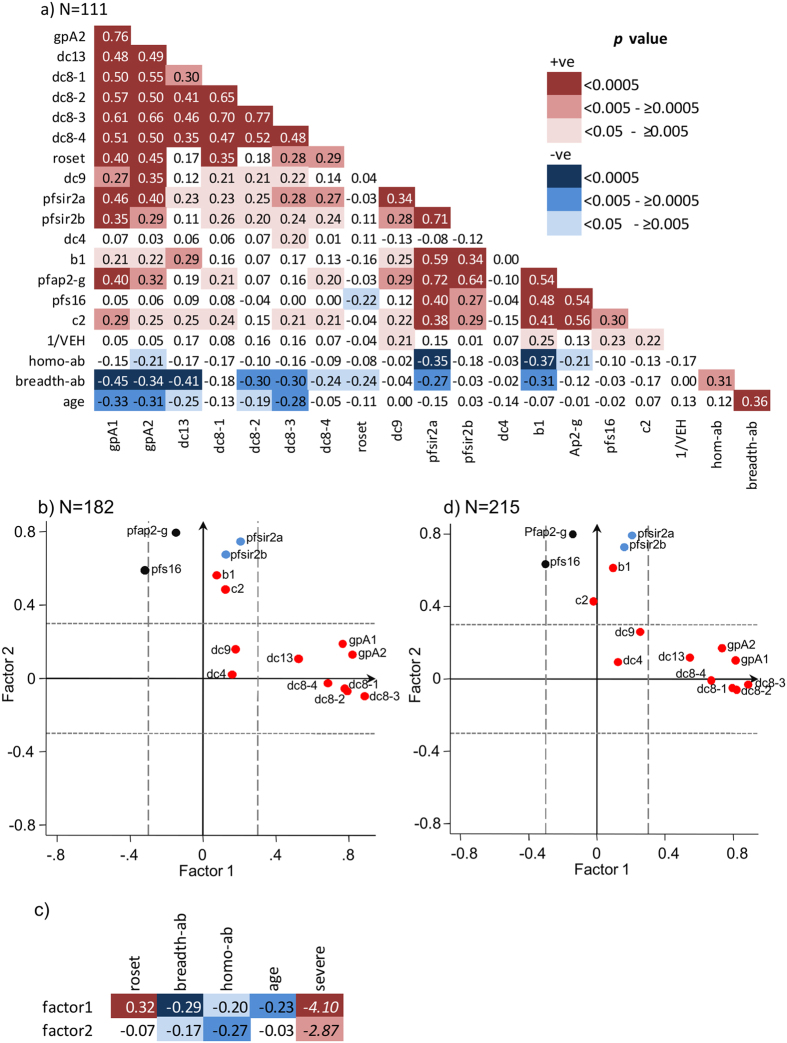
Figure 2. IE surface antibodies associated with global regulation of var gene expression.
(a) Correlation matrix based on Spearman’s rank correlation coefficient test. Shown is the rho value and the background shading was done as described in Fig. 1. N = 111. (b) Principal component factor analysis of var expression (clinical cases only). Red; transcript quantity of the var subclasses represented using the names of the primers (Table S1), Light blue; PfSIR2 expression (Pfsir2a, Pfsir2b), Black; markers of gametocytogenesis (Pfap-2g, Pfs16). Factor loadings above or below 0.3 were considered significant (dashed lines). N = 182 (c) The relationship between predicted factor scores of factor1 and factor2 with rosetting, breadth of host antibodies, host age, and severity of the disease (N=182 except for roset and homo-ab where N=121). Shown is rho and z score derived from Spearman’s rank correlation and Mann-Whitney U tests respectively. Background colouring was done in accordance with the p-value as described in Figs 1 and 2 legends. (d) Same as Fig. 2b except N = 215 and includes data of parasites from 33 children with asymptomatic infection.

