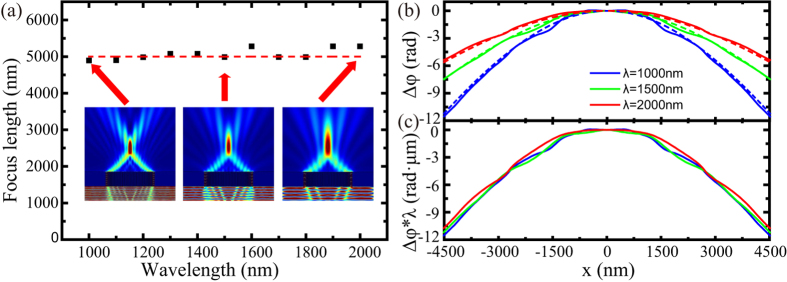
Figure 4. Achromatic plasmonic lens.
(a) Focus lengths of the designed achromatic lens at different wavelength. Electric field intensity  distributions at the wavelength λ = 1000 nm, 1500 nm and 2000 nm are shown in the inset. (b) Numerical (solid line) simulated and ideal (dashed line) phase distribution at 200 nm above the output surface at the wavelength λ = 1000 nm (blue), 1500 nm (green) and 2000 nm (red). (c) Simulated spatial distribution of
  at the wavelength λ = 1000 nm (blue), 1500 nm (green) and 2000 nm (red).

