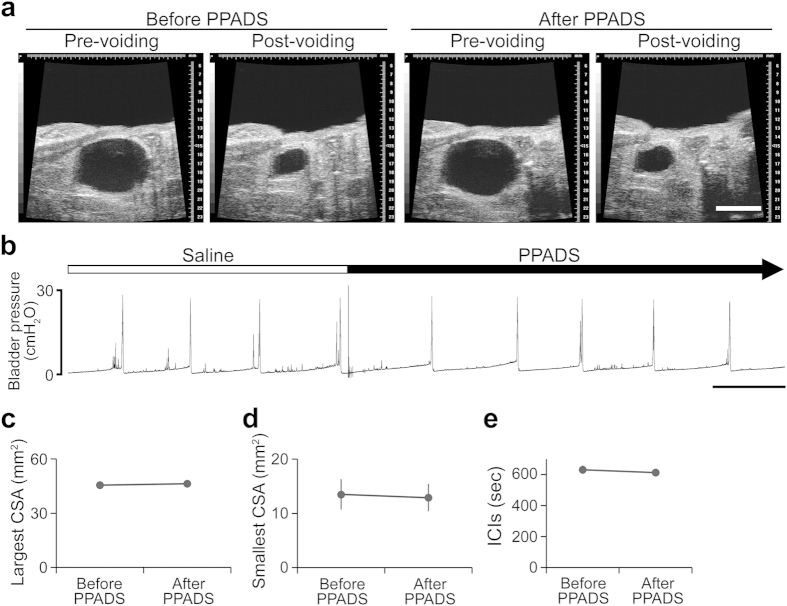
Figure 3. Effects of PPADS on bladder function in WT mice.
(a) Ultrasonographic findings of voiding before and after PPADS treatment. Scale bar, 5 mm. (b) Representative cystometrogram recording chart before and after PPADS administration. Scale bar, 10 min. (c–e) PPADS-induced changes of pre-voiding largest CSA (c), post-voiding smallest CSA (d) and ICIs (e). Paired t-test was used (n = 5, each group). Error bars represent s.e.m., n.s., not significant.

