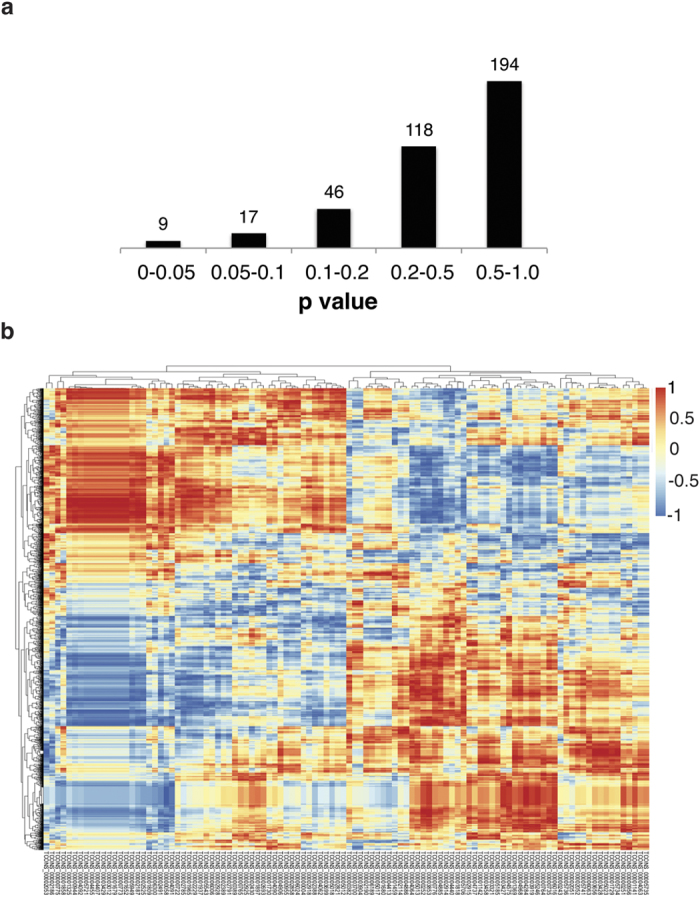
Figure 6. Correlated expression across time points.

(a) 9 lncRNAs show significant Pearson correlation coefficients with an adjacent gene. Number of lncRNAs with the corresponding p-values for correlation with an adjacent gene. Most lncRNAs do not show significant similarity in expression with a neighboring gene throughout the time course. This may be partially due to the low expression levels of the lncRNAs. (b) Many lncRNAs show correlated expression with distant genes. Pearson correlation coefficients were calculated between the lncRNAs and the genome. Hierarchical clustering was performed prior to plotting to group genes showing similar patterns. LncRNAs are labeled below using unique identifiers. Perfect correlation would correspond to a coefficient of 1.0 while perfect anticorrelation would result in –1.0. Pairs showing high correlation or anticorrelation may belong to a co-regulated group of genes or represent in trans regulators. Full scores with gene names shown in Supp. Table 3.
