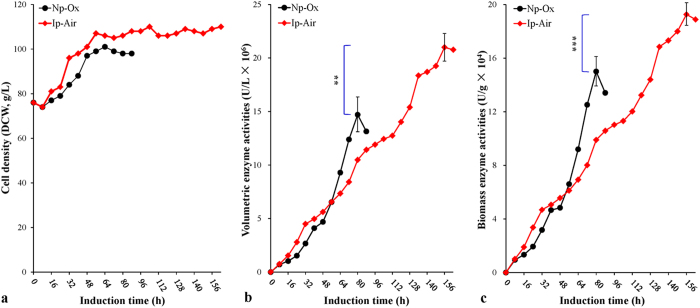
Figure 1. Time-course profiles of the HCDF under the two different conditions: Ip-Air (filled diamond) and Np-Ox (filled cycle).
(a) Cell density profiles (DCW, g/L). (b) Volumetric enzyme activity profiles (U/L). (c) Biomass enzyme activity profiles (U/g). Data are means ± SD of three parallel measurements (*P < 0.05, **P < 0.01, ***P < 0.001). Note, Ip-Air: increasing air pressure without pure oxygen supplement; Np-Ox: normal air pressure (0.05 MPa) with pure oxygen supplement (control).

