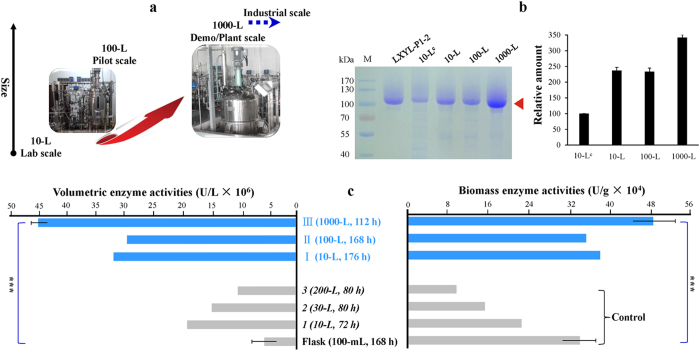
Figure 6. Scaling-up HCDF of P. pastoris under 10-L, 100-L and 1,000-L scales.
(a) Multi-size fermenters scaling-up graphics. (b) SDS-PAGE analysis. The arrow indicates the band of the recombinant enzyme. The relative protein amount (arbitrary unit) of each sample was quantified with Quantity One Software. The values are indicated as means ± SD (n = 3) of independent assays. M, the protein molecular marker; LXYL-P1-2, the purified recombinant enzyme (glycosylated protein) prepared by gel column choromatography (HPLC) in our lab; 10-LC, the sample before optimization (Np-Ox, as a control); 10-L, 100-L and 1,000-L, the samples after optimization. (c) Summary of the optimization and scaling-up processes with the controls of the flask fermentation (100-mL), the 10-L scale HCDF (Np-Ox), the 30-L scale HCDF (Np-Ox), and the 200-L scale HCDF (Np-Ox) before optimization, showing the volumetric and biomass enzyme activities at the peak time (except the 112 h in the 1,000-L scale). Error bars show means ± SD of triplicate independent assays.

