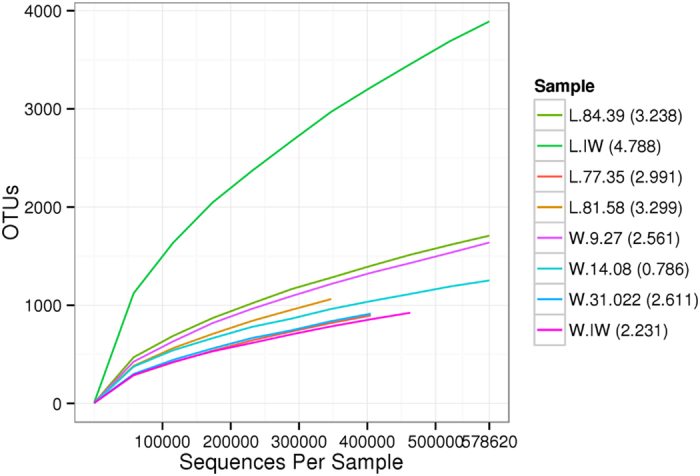
Figure 1. Rarefaction analysis for each sample.

The rarefaction curves in the figure represent the OTUs vs sequences in each sample. Numbers in parentheses in the legends are the Shannon indices of each sample.

The rarefaction curves in the figure represent the OTUs vs sequences in each sample. Numbers in parentheses in the legends are the Shannon indices of each sample.