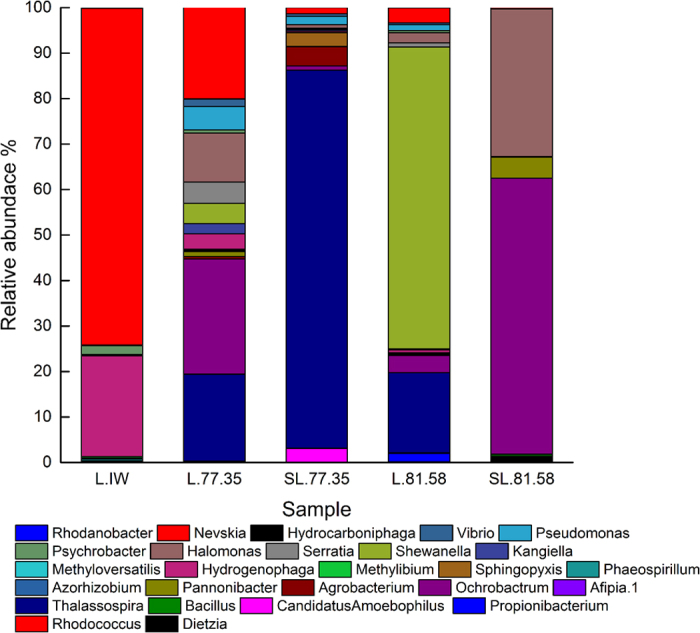
Figure 6. Comparison of the dominant bacteria before and after the stimulation by the addition of activator at the genus level.

L.IW, L.77.5 and L.81.58 were the initial water samples of the oil well, and SL.77.35 and SL.81.58 were stimulated production water samples.
