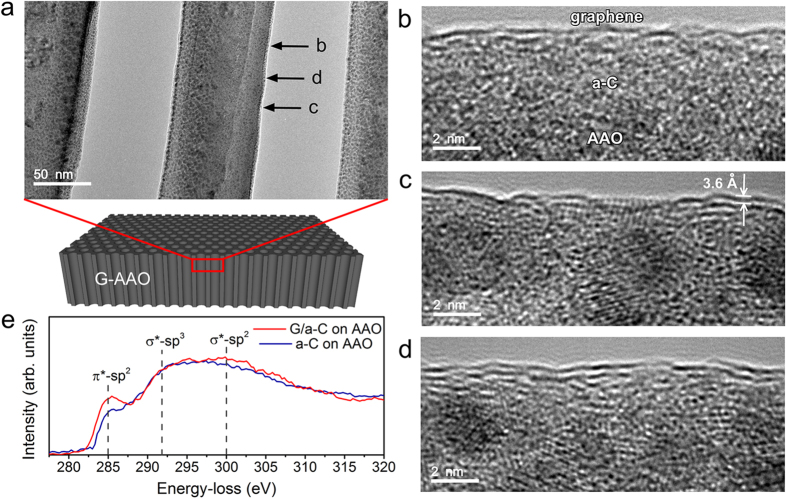
Figure 3. TEM and EELS analysis of G-AAO produced by method 1.
(a) Cross-sectional TEM picture of the porous structure inside G-AAO, while the schematics below illustratively indicates the location analysed. (b-d) High magnification images taken from the corresponding regions in (a), which indicate monolayer graphene, a combination of monolayer and few-layered graphene (where the interlayer distance is 0.36 nm), and FLG, respectively. (e) A comparison of EELS results between G-AAO (red) and a-C-AAO (blue).

