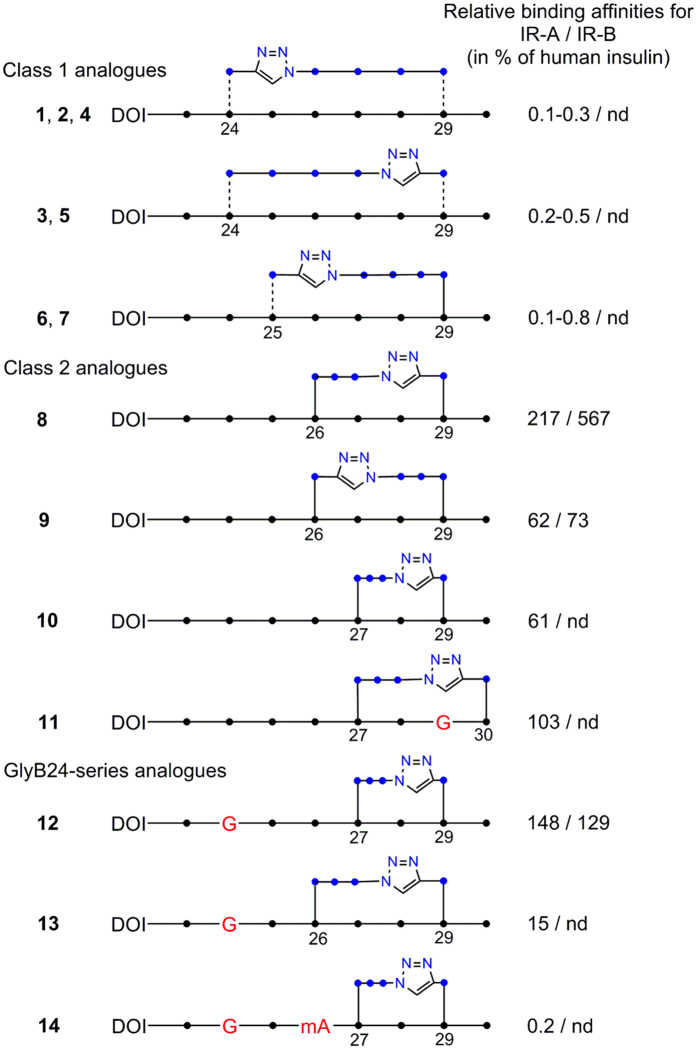
Figure 2. Schematic representation of intra-chain crosslinked octapeptides in the insulin analogues 1–14 produced in this work.
Black dots (●) indicate the Cα carbons in the backbone and blue dots (●) indicate CH2 atoms in the linkers. Dashed lines indicate alternative chirality. G in red indicates the positions of Gly mutations. mA in red indicates the position of N-methylated alanine. The binding affinities (in %) relative to native insulin are shown to the right. Triazole rings are shown as pentagrams with blue nitrogen atoms. nd stands for not determined. DOI is des(B23–B30)octapeptide-insulin.

