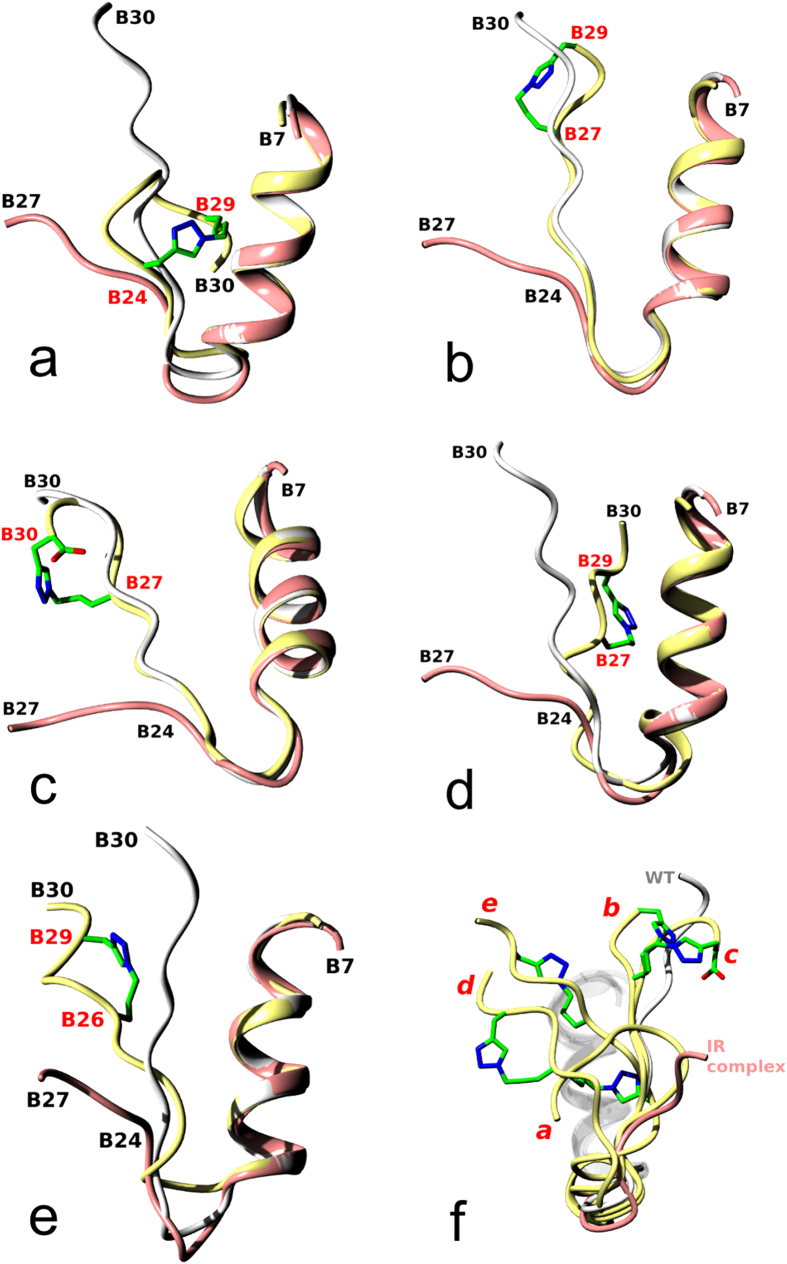
Figure 3. Comparison of range of conformations of the B-chain observed in the structures of the wild-type human insulin (white), insulin in the IR complex (coral), and in the analogues discussed in this work (yellow):
(a) 2, (b) 10, (c) 11, (d) 12, and (e) 8. The carbon atoms of the crosslinks are in green, and the nitrogens in blue; crosslinked sites are labeled in red; in (c), the C-terminal carboxyl group (part of one crosslink precursor) is also given. The wide spectrum of crosslink-generated conformations of insulins is shown in (f ) by superposition of the analogues given in (a–e). The red letters at the analogues correspond to the structures in panels (a–e); wild-type (WT in white, pdb 1 mso) and IR-complexed insulin (coral, pdb 4 oga) are also given with all B7–B19-helices shown in white.

