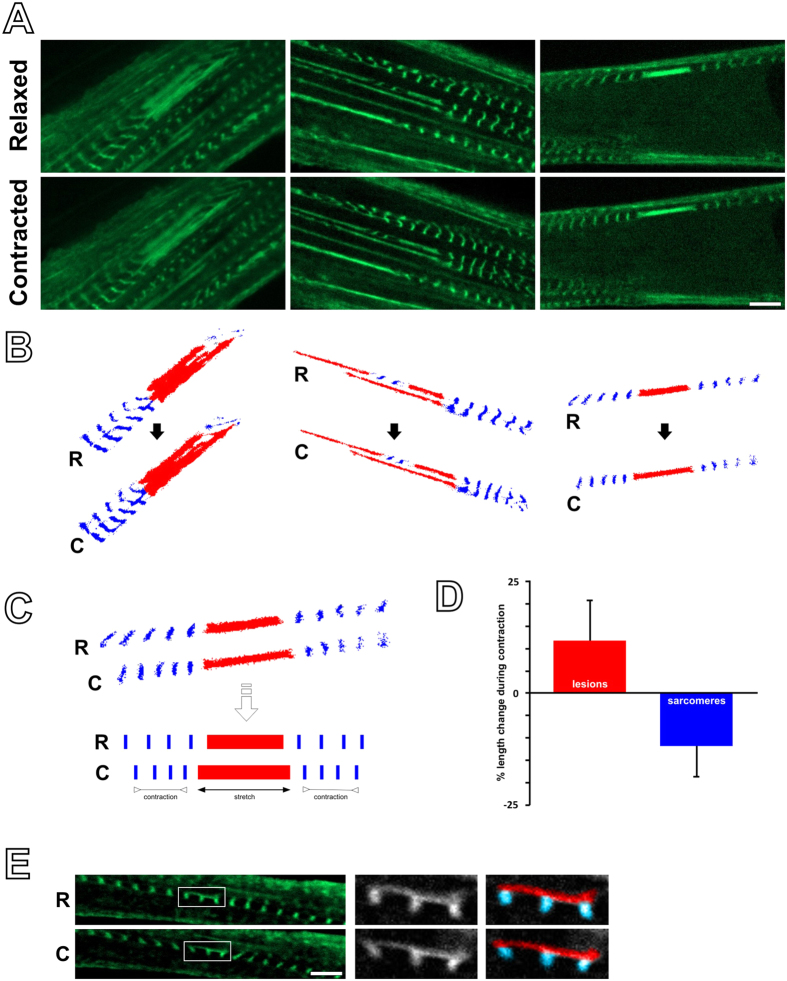
Figure 4. Lesions stretch during contraction.
(A) Examples of lesions photographed in a relaxed state and during a tetanic contraction, as seen by live cell imaging in C2C12 myotubes expressing FLNc-EGFP. (B) For clarity, lesions from the panels above are marked in red, and surrounding Z-discs of the neighbouring sarcomeres in blue. (C) During contractions, lesions become stretched and elongate, whereas the neighbouring sarcomeres shorten (as seen by their Z-discs). (E) Quantification of the percentage change in length of the lesions and neighbouring sarcomeres (lesions from 23 individual cells analysed, error bars represent standard deviation). (F) Example of two sarcomeres showing Z-disc streaming only in part; during contraction, the part with the lesion stretches, while the unaffected part contracts. (Scale bar = 5 μm).

