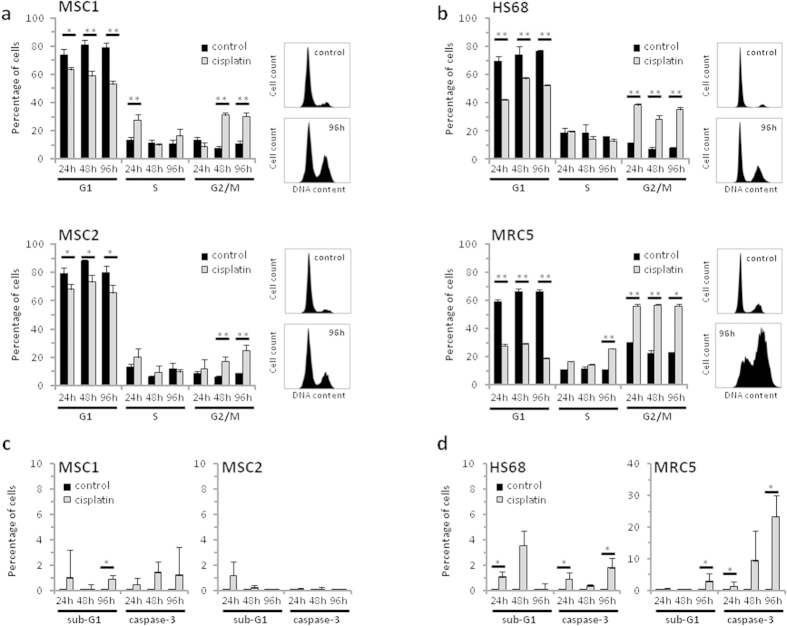
Figure 2. Cisplatin treatment of MSCs results in G2 phase arrest but no increase in apoptosis.
Cell cycle distribution of two MSC samples (a) and two fibroblast cell lines (b) after 4-hour treatment with 1000 ng/mL cisplatin. (c,d) Percentage of apoptotic MSC1, MSC2 stem cells and HS68 and MRC5 fibroblasts after 1000 ng/mL cisplatin as assessed by sub-G1 population and caspase-3 activation. Error bars represent standard deviation (n = 3). *P < 0.05, **P < 0.01.

