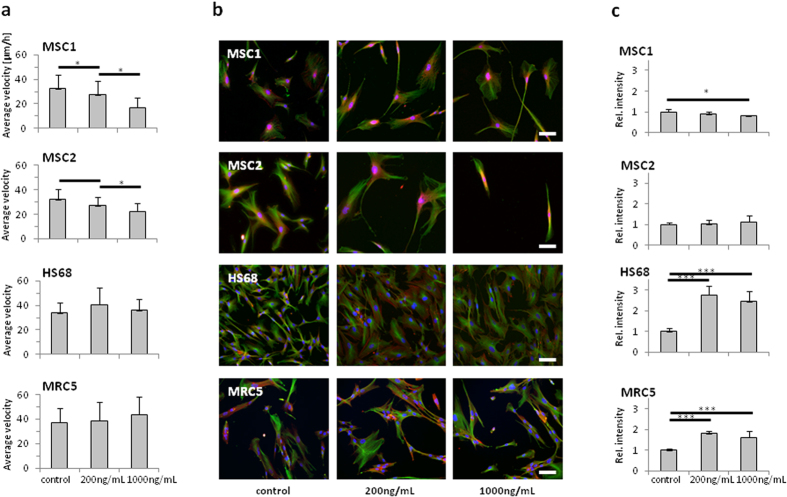
Figure 4. MSCs reveal reduced motility after cisplatin treatment.
(a) Average velocity of MSCs and differentiated fibroblasts after treatment with 200 and 1000 ng/mL cisplatin. (b) Immunofluorescent actin and microtubule staining in MSCs and fibroblasts after cisplatin treatment (20× objective, scale bar 100 μm). (c) Quantification of actin staining after cisplatin treatment (n ≥ 6). *P < 0.05, ***P < 0.001.

