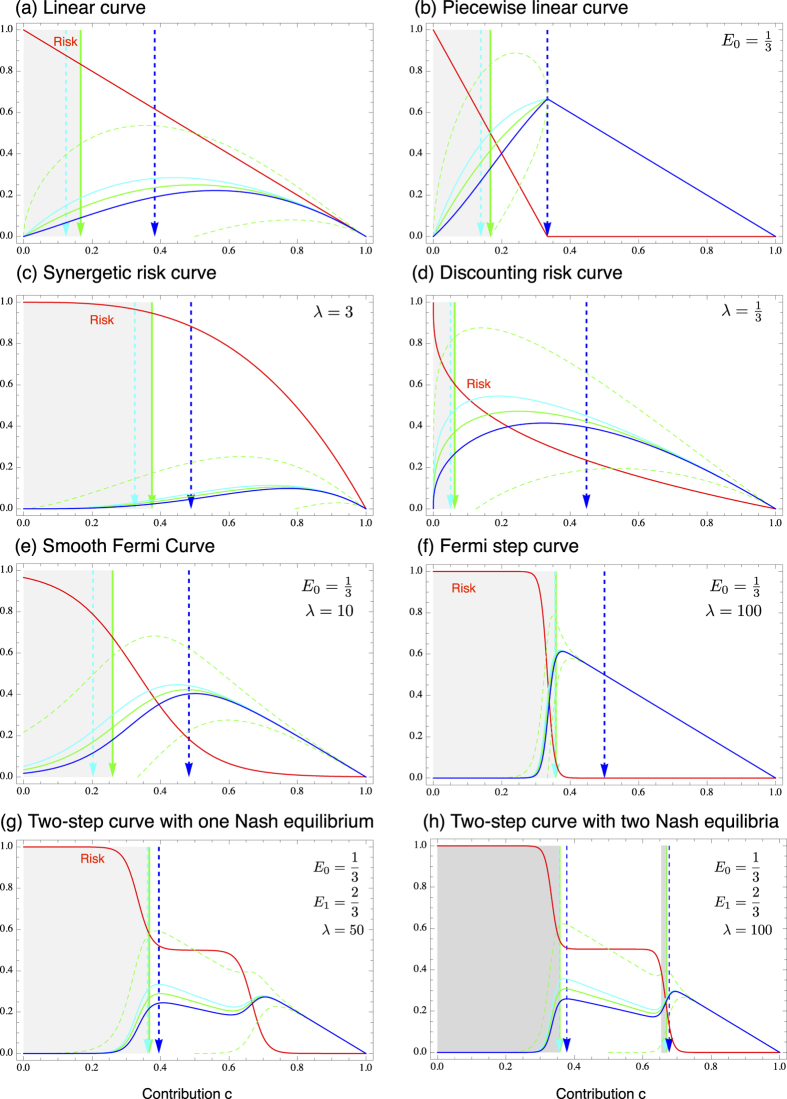
Figure 3. Equilibrium contributions with preferences.
In general, risk seeking players (α = +0.5 in all panels) tend to contribute less while risk avoiding players (α = −0.5 in all panels) tend to contribute more than players who are risk neutral, α = 0. The full lines in the colors corresponding to the different risk types are the average payoffs. (a) For the linear curve, the asymmetry in the variance leads to a much larger deviation for negative α. (b) For the piecewise linear curve, the risk avoiding individuals contribute much more and would end up in the social optimum. (c–h) Depending on the shape of the standard deviations, the change induced by negative α can be very small, while the changes induced by positive α are much larger (all parameters as in Fig. 1).

