
Figure 2. Mutational landscape of cisplatin-resistant SCCHN.
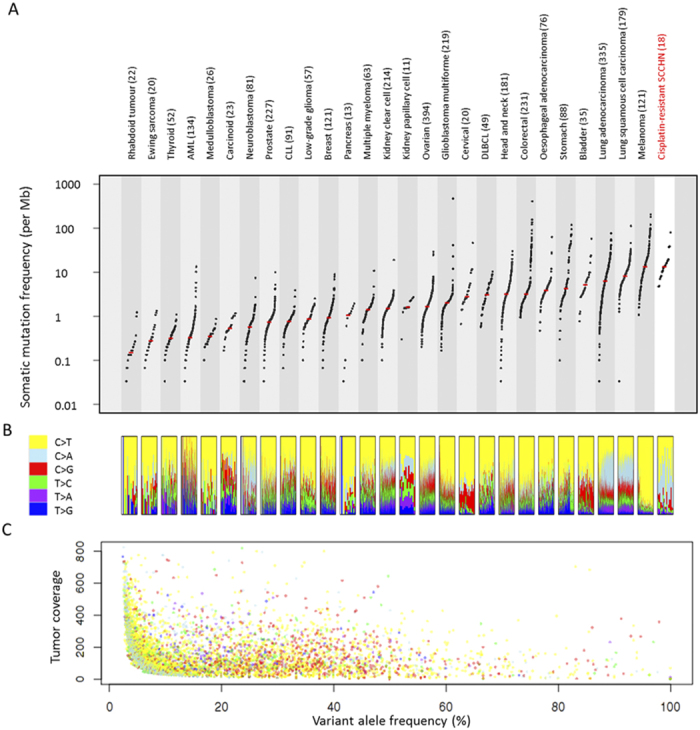
(A) Mutation rate in cisplatin-resistant SCCHN compared to mutation rate in other major tumor types. Each dot represents the mutation rate in a single tumor. The median mutation rate is indicated by red bar (B) Relative proportion of the six mutational spectra as indicated in the legend box in each tumor sample. (C) Variant allele frequency in SCCHN. Each dot represents the variant allele frequency of a predicted mutation. Colors indicate the mutational spectra as indicated by legend box in Fig. 2B. Design and data for Fig. 5A,B are obtained from previous literature13.