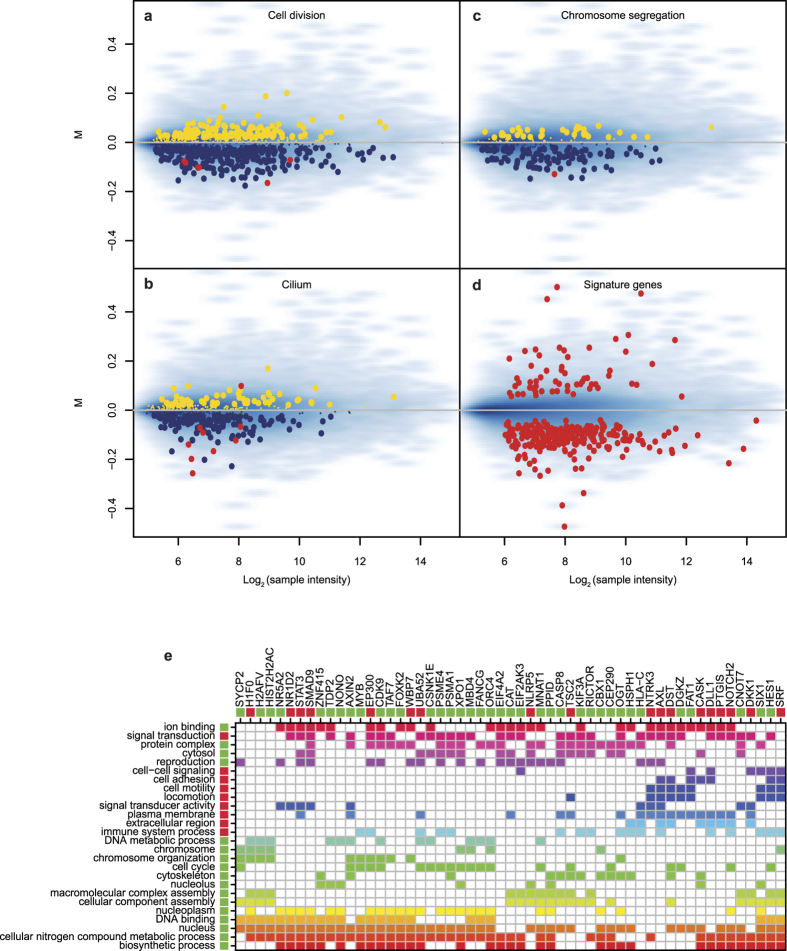
Figure 2. Gene set enrichment analysis.
(Panels a to d) show the gene expression of RIF patients compared against controls (log2 fold change or M) and the average expression across all samples (log2 sample intensity). (Panels a to c) each focus on an example of a Gene Ontology term which was found to be significant in GSEA. Genes in the GO term up-regulated in RIF patients are shown in yellow, genes down-regulated in blue. Shown in red are the genes which are also part of the 303-gene signature. Genes that are not part of the GO term are shown as a blue density map where darker blue indicates higher gene density. (Panel d) shows all the genes of the gene signature. (Panel e) shows a selection of 55 genes from the 303-gene signature and 26 GO terms in which they are involved. The genes selection was based on the number of GO terms associated to the gene (>6), the GO terms were selected based on their statistical significance in the GSEA and the number of genes associated (>6). The selection was performed for visual clarity. The bars below the gene names and to the right of the GO terms indicates whether a gene/GO term is up-regulated in RIF patients (red) or down-regulated (green). All other colours are solely for visualization purposes and do not indicate strength of association. The rows and columns are clustered based on Euclidean distance. For an unfiltered version see Supplementary Fig. 7.

