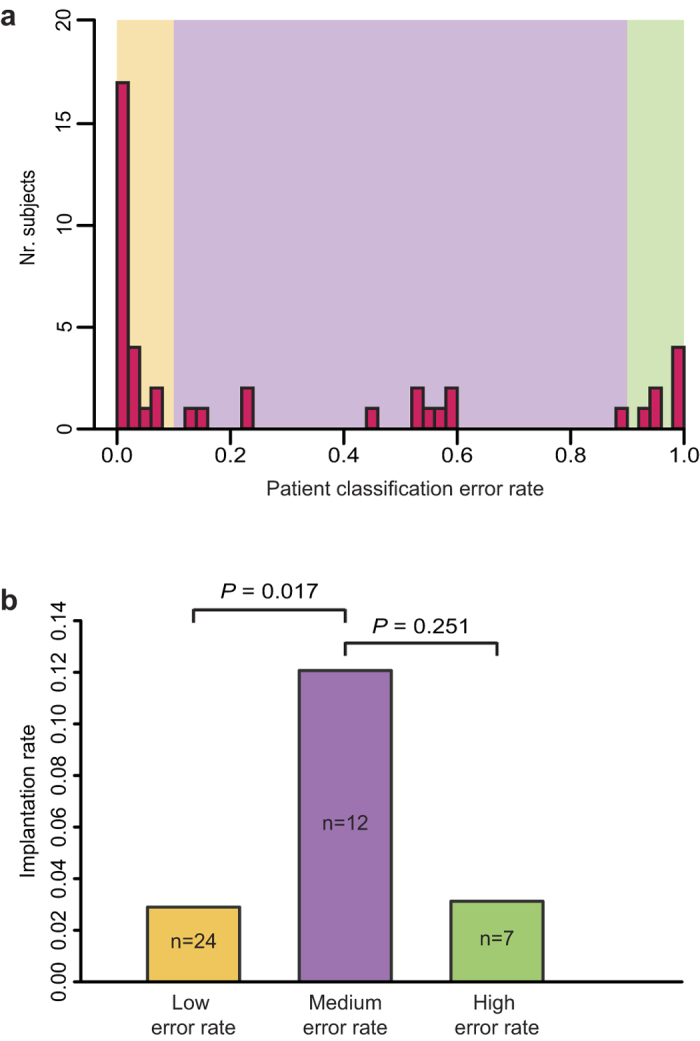
Figure 3. Patient stratification.

(Panel a) shows the distribution of the RIF patient classification error rates (n = 43). The error rate is the ratio of misclassifications to number of classification attempts (see Methods for details). The coloured rectangles denote patient groups with similar error rates (low < 0.1, medium ≥ 0.1 & ≤ 0.9, high > 0.9). (Panel b) shows the IVF implantation rate for the three aforementioned patient groups. Implantation rate is defined as implantations per embryo transfer (prior to the biopsy) and includes all outcomes: i.e. biochemical pregnancy, miscarriage, live birth. P was calculated using a two-sided Fisher’s exact test comparing combined outcomes of all IVF cycles.
