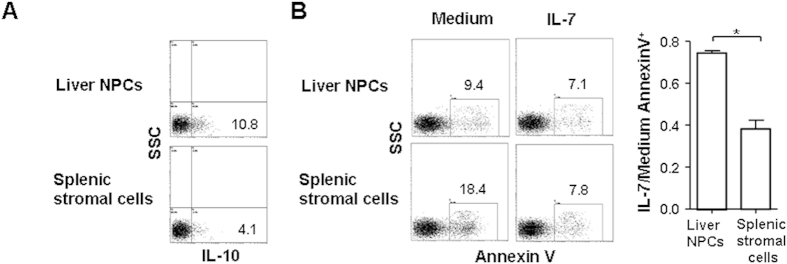
Figure 3. Liver NPCs induce the tolerogenic phenotype in CD4+ RTEs.
CD4+ RTE precursors (CD4+ CD8− Qa2+ CD69− CD44lo thymocytes, 5 × 10⁵ cells per well) were stimulated with anti-CD3 (2 μg/ml) and anti-CD28 (1 μg/ml) in the presence of 1 × 10⁵ NPCs or 1 × 10⁵ splenic stromal cells. On the third day, 2 ng/ml rhIL-2 was added. After 5 days of co-culture, the T cells were collected for further analysis. (A) Increased IL-10 production in T cells co-cultured with liver NPCs. T cells were re-stimulated with plate-bound anti-CD3 (2 μg/ml) for one day and IL-10 production was measured by flow cytometry. (B) Reduced IL-7 responsiveness in T cells co-cultured with liver NPCs. T cells were cultured in the presence or absence of 1 ng/ml IL-7 for one day and Annexin V staining was used to measure the apoptosis of T cells. The apoptosis of T cells cultured in the presence of IL-7 was calculated against that of cells cultured in medium and the mean ratios of three independent experiments were shown on the right.

