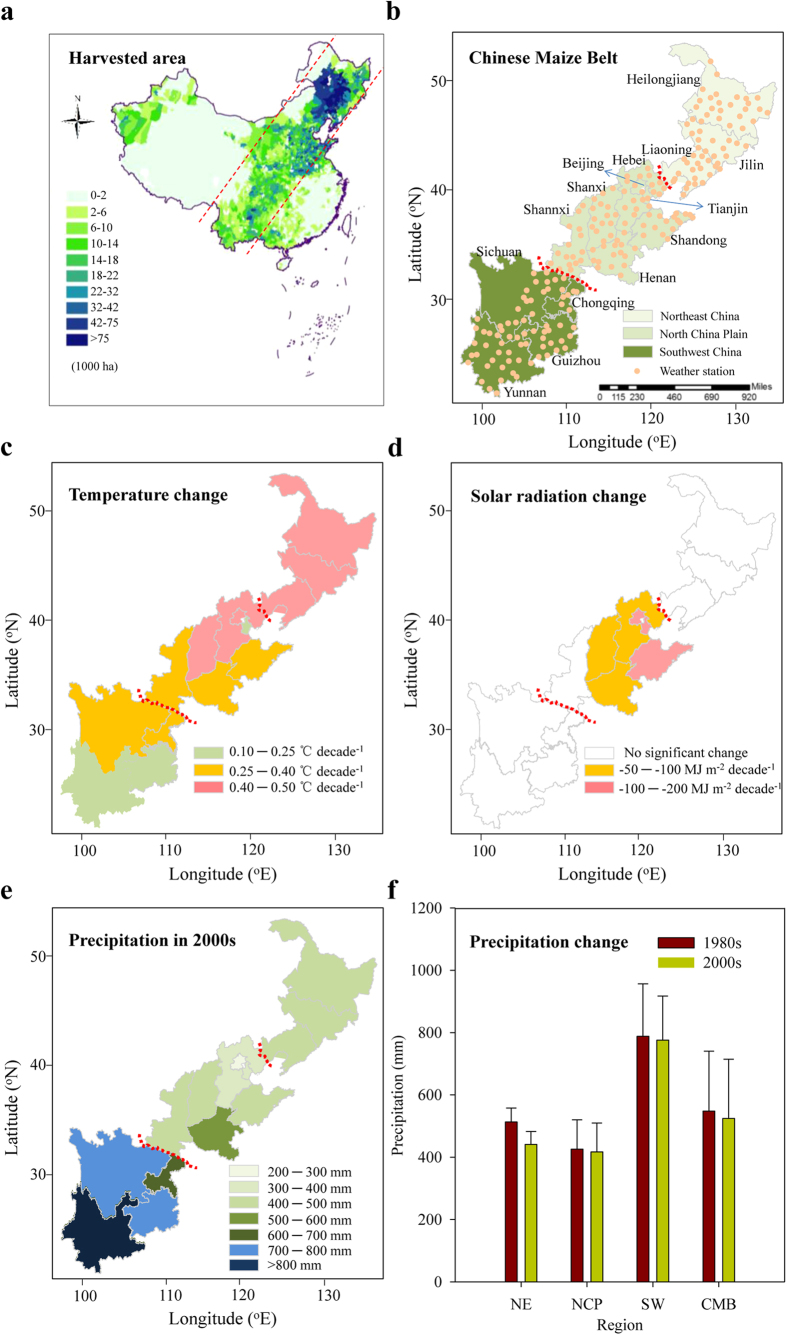
Figure 1. Maize production areas in China, and the Chinese Maize Belt (CMB) and its climates during the maize growing season.
(a) Maize production area according to county-level data. (b) Location of CMB and weather stations. (c) Temperature changes (increases in all cases) from 1980–2009. (d) Solar radiation change from 1980–2009. (e) Average precipitation in the 2000s. (f) Average precipitation in regions of the CMB in the 1980s and 2000s. In any region, the precipitation during the maize growing season did not significantly differ between the 1980s vs. the 2000s (P < 0.05). NE, NCP, and SW refer to Northeast China, the North China Plain, and Southwest China, respectively. Error bars indicate one standard deviation. We first made the standard module with ArcGIS 10.0 for the province level and then copied to the PowerPoint 2010. Then we made the individual map. Second, the maps in Fig. 1a–f were generated in PowerPoint 2010.

