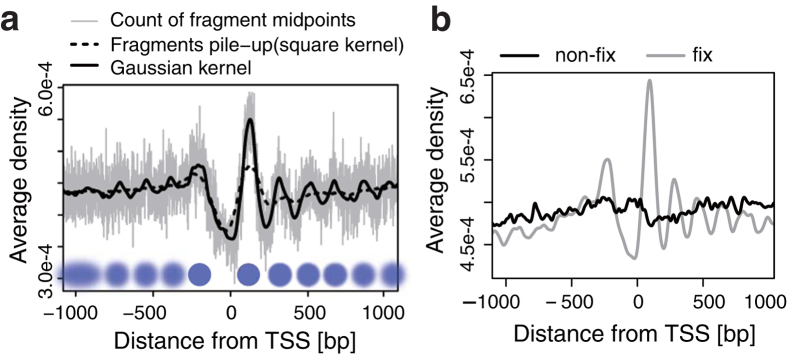
Figure 1. Density estimation of nucleosomes from fixed MNase-Seq.
(a) Comparison of signal processing methods for single PAND analysis. The X-axis shows the distance (in bp) from the TSSs, and the Y-axis shows nucleosome density averaged over all genes. The grey line represents counts of fragment mid-points with 1 bp resolution. The black solid line shows these counts smoothed by a Gaussian kernel, and the dotted line represents the result of fragment pile-up in which mapped reads are extended to the fragment length and accumulated. The blue circles represent inferred positions of the nucleosome (blur: fuzzy, solid: well-positioned). (b) A PAND within 1 kbp of a TSS in fixed (grey) and non-fixed (black) samples. The effect of fixation was evaluated for mono-nucleosome sized samples. See Supplementary Figure S1d for fragment size. Fixed samples show clearer positioning around TSSs.

