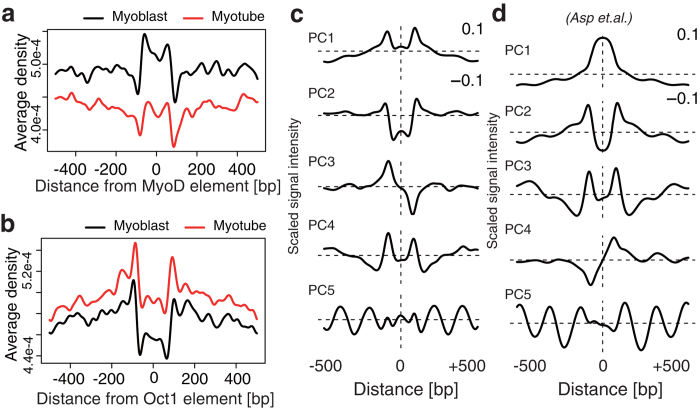
Figure 2. Five components extracted from PAND shapes around cis-regulatory elements.
(a,b) PANDs of MyoD (a) and Oct (b) within 500 bp of their cis-regulatory elements. The X-axis denotes the distance (in bp) from the origin of the centre of a cis-regulatory element, and the Y-axis denotes the nucleosome density averaged over all cis-regulatory elements. (c,d) Principal components of the 258 PANDs. (c) The 1st to 5th principal components (top to bottom) were ordered by the contribution ratio and contributed approximately 80% of the cumulative contribution ratio. (d) The principal components of the ChIP-Seq input data from Asp et al.22.

