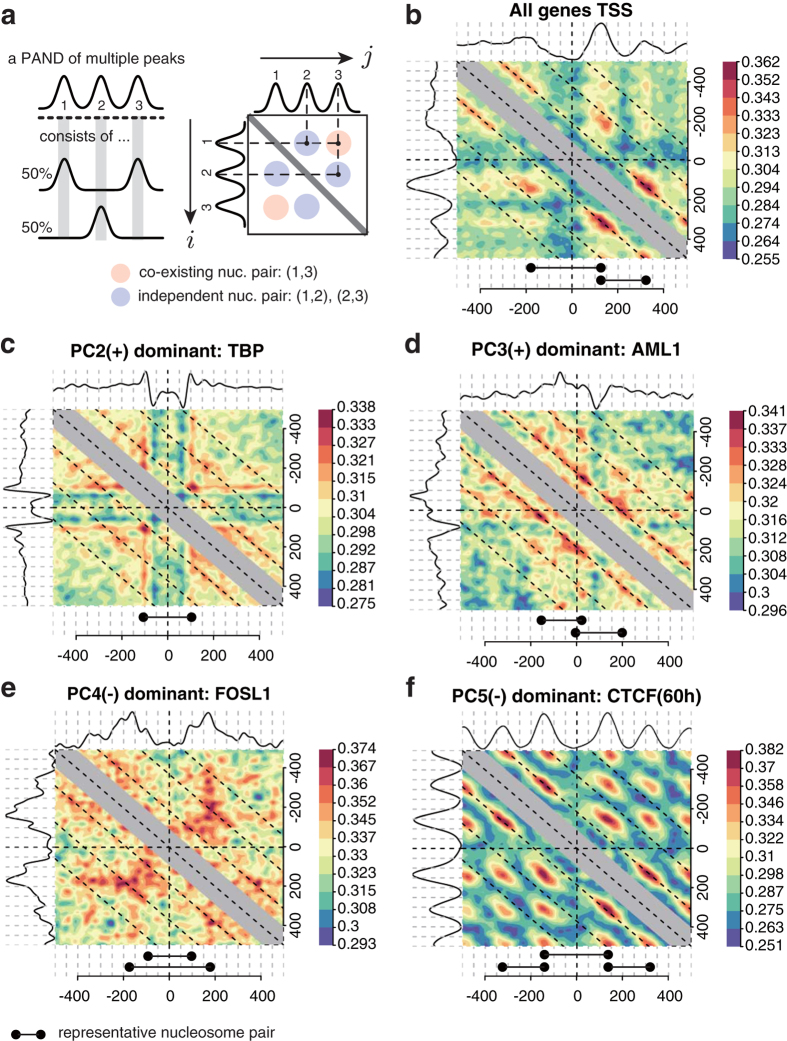
Figure 4. Frequently appearing nucleosome pairs.
(a) Scheme of the nucleosome pair extraction method. A PAND with three peaks: 1, 2 and 3, which indicate three nucleosomes, is shown. However, the PAND is not sufficient for analyzing nucleosomes that appear at the same locus (a, left). Therefore, the degree of co-existence at two arbitrary points around an anchor-point was visualized (a, right). The pairs (1, 2) and (2, 3) indicate nucleosome pairs that appear independently, while the pair (1, 3) is a co-existing nucleosome pair at a single locus. (b–f) Examples of NPs based on all mouse genes’ TSSs and PC2-5, which show a representative cis-regulatory element or TF with high scores of each PC. The respective PAND shape is located at the top and left of each matrix. The colour-bars indicate the cosine similarity of a position pair in a matrix. Representative NPs are shown at the bottom of the matrices.

