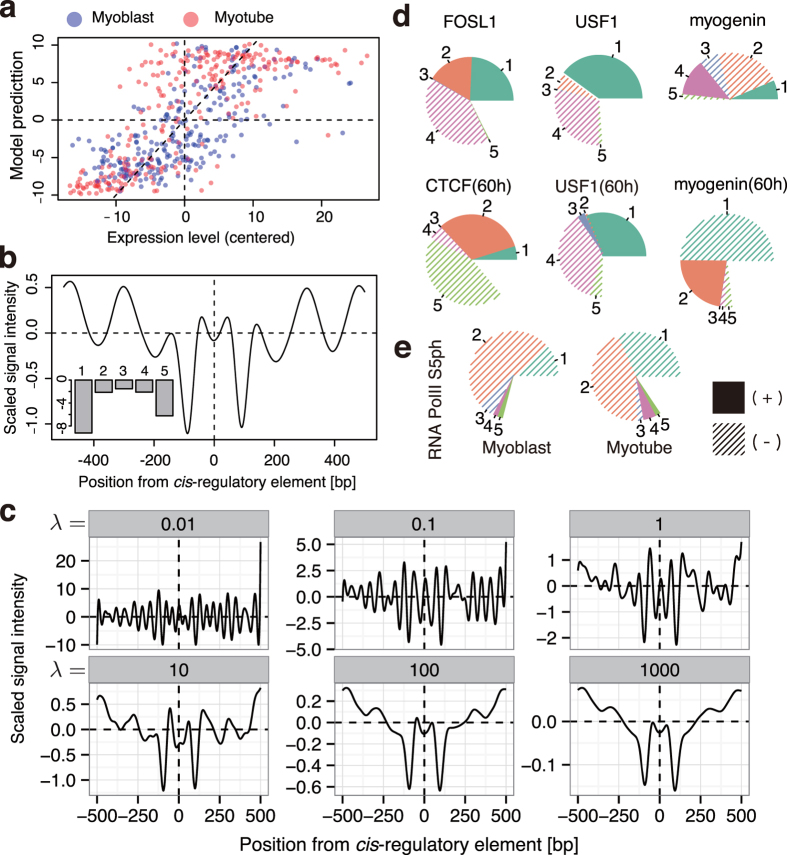
Figure 5. Functional profile of the five components.
(a) PCR model-predicted gene expression levels. The x-axis indicates centred average gene expression level associated with each of the 258 cis-regulatory elements. The y-axis indicates gene expression level by PCR model. Blue and red points indicate myoblasts and myotubes, respectively (n = 512). (b) The wave shape and its PC weights of the best NP pattern for gene expression prediction by PCR are shown. The x-axis indicates relative position from the cis-regulatory element (the centre is at x = 0), the y-axis indicates scaled and centred MNase-Seq signal intensity. The left-bottom bars represent the weights of PC1-5 (labelled as 1–5) of the wave shape. (c) The best NP pattern for predicting gene expression derived by ridge regression analysis. The six boxes show the result of the best NP patterns with various bias parameters and λ values. The λ values are shown in the head of each box. The x and y-axes are the same as in (b). (d) Functional profile of ENCODE TFBS data in mouse C2C12 cells. The weight of each component is presented as a pie chart where the composition ratios (%) of the five components are indicated. Numbers correspond to PC1-5. Composition ratios from components other than PC1–5 are shown as blank regions. (e) Functional profiling of RNAP2-Ser5ph in myoblasts/myotubes shown in (d).

