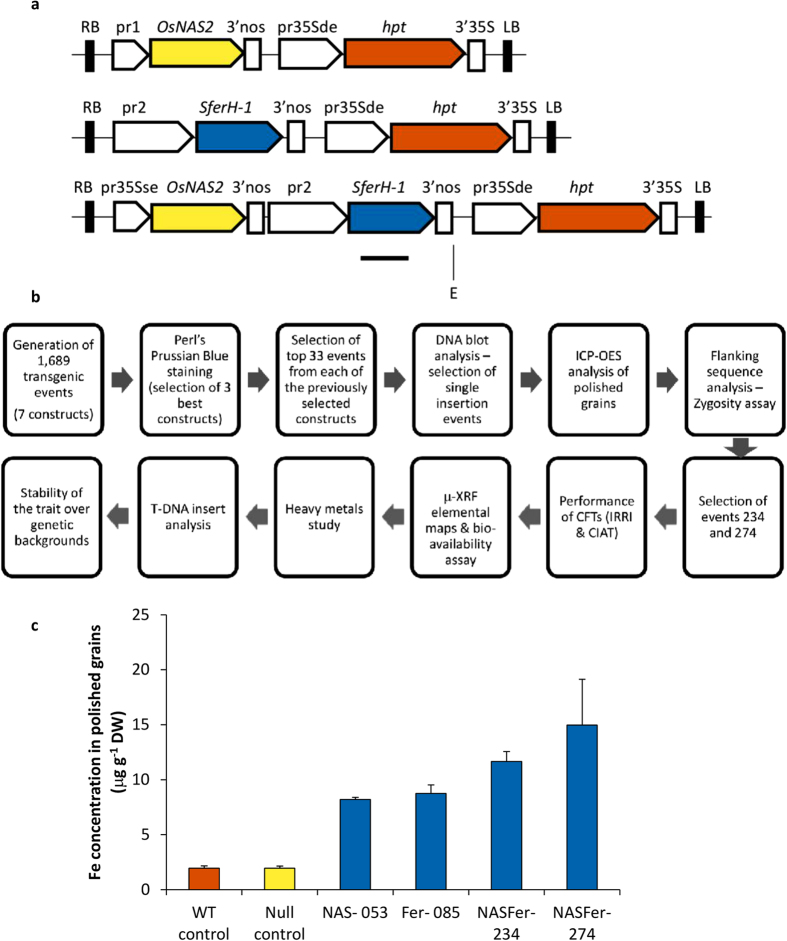
Figure 1. Strategy for the development of biofortified high-iron rice and the Fe concentration achieved in T2 polished seeds.
(a) Schematic diagram of the T-DNA constructs prepared for rice transformation for the purposes of our study. RB and LB represent the right and left borders of the T-DNA, respectively; pr1: represents the constitutive promoters pr35S with single enhancer (pr35Sse), maize ubiquitin promoter, or rice endosperm-specific promoter glutelinB1; pr2: represents the rice endosperm-specific promoters glutelinB1 or glutelinA2; pr35Sde represents the constitutive promoter pr35S with double enhancer; OsNAS2: Oryza sativa nicotianamine synthase 2; SferH-1: Glycine max ferritin subunit H-1; hpt: hygromycin phosphotransferase; 3′nos: 3′UTR of nopaline synthase; 3′35S: 3′UTR of 35S cauliflower mosaic virus gene. The horizontal line below SferH-1 represents the deduced hybridization position of the digoxigenin-labeled cDNA probe; E: EcoRI. (b) Flow-chart displaying the steps that have been followed for the development of biofortified high-Fe/-Zn rice. (c) Fe concentration (μg g−1 DW) of polished seeds harvested from T1 homozygous plants of representative NAS, Fer, and NASFer events, null segregant, and non-transformed rice under screenhouse conditions. Bars represent the means ± s.d. of three replicates.

