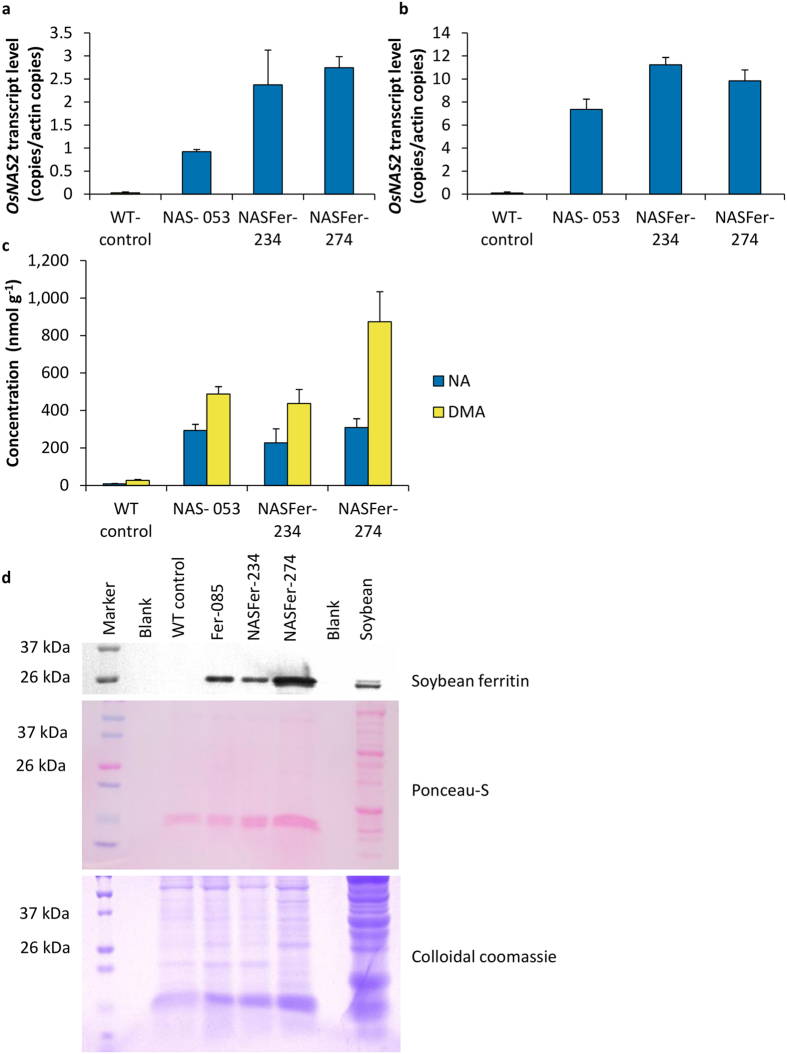
Figure 2. Expression of transgenes in the representative events.
(a) Relative quantification of OsNAS2 transcript levels of representative NAS and NASFer events and non-transformed rice in the roots of 8 days old seedlings. Bars represent the means ± s.d. of three biological replicates, each with three technical replicates of real-time RT-PCR. (b) Relative quantification of OsNAS2 transcript levels of representative NAS and NASFer events and non-transformed rice in the leaves of 8 days old seedlings. Bars represent the means ± s.d. of three biological replicates, each with three technical replicates of real-time RT-PCR. (c) NA and DMA concentrations in T2 homozygous polished seeds of representative NAS and NASFer events and non-transformed rice. Bars represent the means ± s.d. of three replicates. (d) Immunoblot analysis of soybean ferritin protein in T2 polished seeds of representative Fer and NASFer events, non-transformed rice, and soybean. Ponceau-S staining of the membrane and colloidal coomassie staining of the gel served as loading controls.

