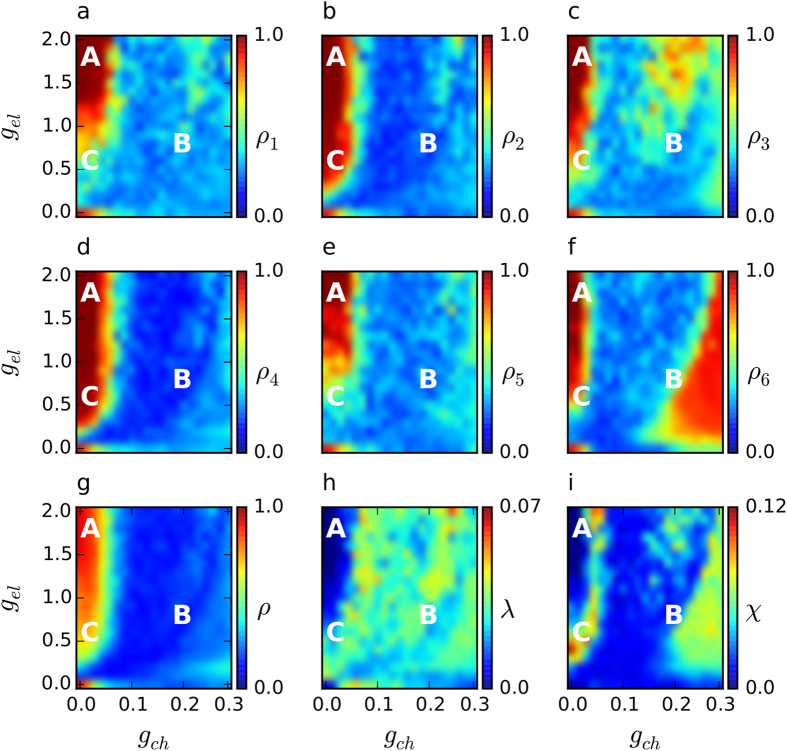
Figure 2. Parameter spaces.
Density plots show the order parameters as well as the metastability and the chimera-like index in the same (gch, gel) plain. The order parameter of each community  is shown in (a–f), and of the entire network in (g). The metastability index is shown in (h) and the chimera-like index in (i) (note the different range of values in the color bar in (h,i)). The marked points A (gch = 0.015, gel = 1.7), B (gch = 0.18, gel = 0.7) and C (gch = 0.015, gel = 0.5) denote three different dynamical regimes. Synchronization is clear within each community in the regime where point A is chosen and corresponds to low values of both, λ and χ. Point B characterizes a regime where the synchronization index of each community and of the entire network is very low, χ is also low and λ is high. This indicates a highly metastable behavior and desynchronous dynamics. An interesting behavior is found on the edge that separates those two regimes, where point C is located. Some communities (obviously 2 and 4, less clearly 6) are synchronous and others (1, 3 and 5) are desynchronous. Furthermore, λ is low, whereas χ is high, meaning that this state is not metastable and chimera-like dynamics can be observed. The dynamical behavior in these points is illustrated clearly in Fig. 3.

