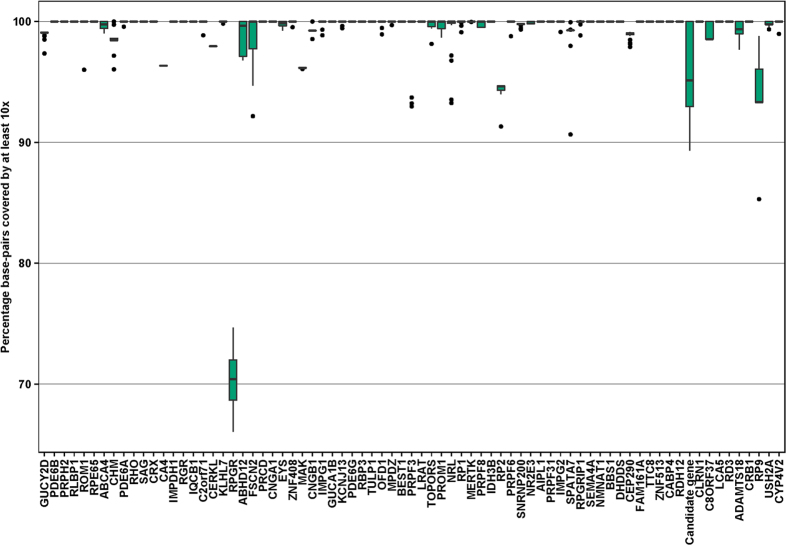
Figure 1. Coverage Boxplot.
Overview of 75 genes and the percentage of coding bases covered by at least 10 reads. For each of the 75 genes the percentage of bases not covered by 10 or more reads is shown for the 47 samples. The green colored box indicate the first and third quantile and the black horizontal bar within the box illustrate the median (or second quantile). Measurements are considered outliers (black dots in plot) when they are: 1) less than the first quantile – 1.5xIQR or 2) greater than the third quantile +1.5 × IQR, were the IQR is the “Inter quantile range” (Third quantile – first quantile).

