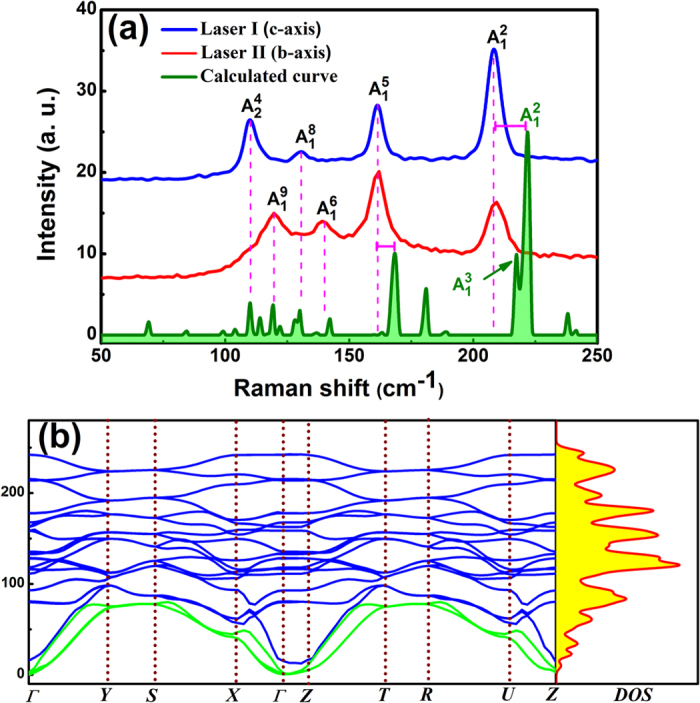
Figure 2. Experimental and calculated phonons.

(a) Raman spectra of the bulk sample with incident Laser I and Laser II along the c- and b-axes at room temperature, respectively. The calculated Raman spectrum is plotted for comparison. (b) Calculated phonon dispersion curve along the Γ-Y-X-Γ-Z direction in the orthorhombic Brillouin zone (BZ), and the vibrational density of states (DOS) for WTe2 bulk at the equilibrium volume. The blue and green curves are the optical and acoustic vibrational branches, respectively.
