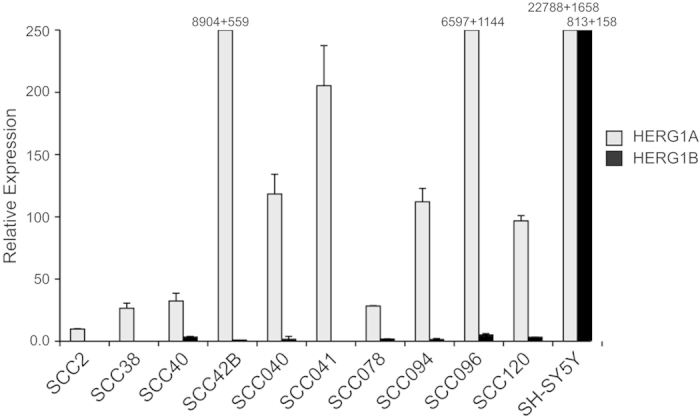
Figure 1. Analysis of HERG1A and HERG1B mRNA levels by real-time RT-PCR in HNSCC-derived cell lines.

Data are expressed as the fold change in HERG1A or HERG1B levels in the HNSCC-derived cell lines normalised to L19 mRNA levels. The graph represents the means + SD of two independent experiments performed in quadruplicate. SH-SY5Y cells were included as a positive control.
