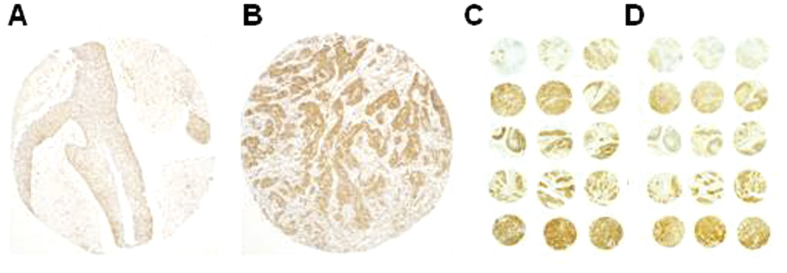
Figure 2. Immunohistochemical analysis of HERG1A expression in HNSCC tissue specimens.
Representative examples of head and neck carcinomas showing HERG1A-negative staining (A) and strong positive cytoplasmic staining (B), five representative cases (rows 1 to 5) from a HNSCC tissue microarray stained with either HERG1A-specific (C) or HERG1 (pan) antibodies (D). Three tissue cores from the same tumour block are shown on each row. A HERG1A-negative case (row 1) and four HERG1A-positive cases (row 2–5).

